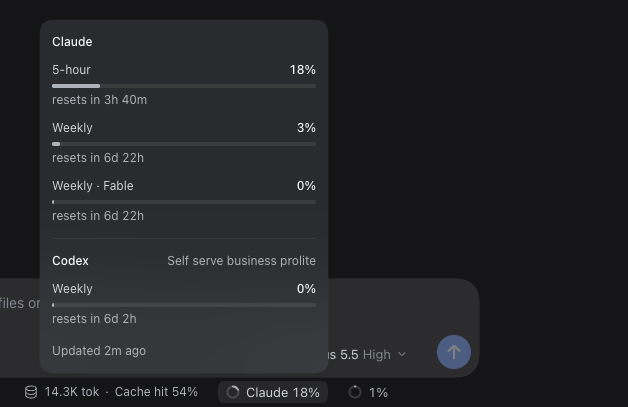
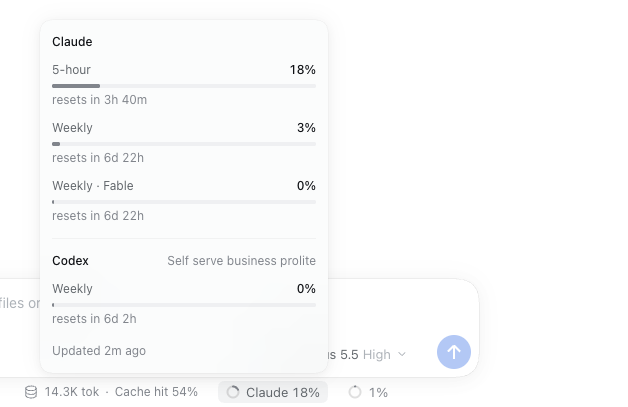
Shows how much of your Claude and Codex plan limits you have used: a line above the prompt in dst with 5-hour and weekly windows, percent used and time to reset, and a ring meter beside the context meter in dsh web that opens a panel listing every window.
Install
# from GitHub (first run asks for allowBuilds approval — follow the hint, retry)
dsh plugin --profile web add github:jakehemmerle/dsh-usage-limits
Any plugin you install runs third-party code with your own permissions — it can read your files, use your credentials, and reach the network, and tool approvals don’t sandbox it. GitHub-sourced plugins also run build scripts at install time — pnpm blocks those until you allow them, so an install can stop with ERR_PNPM_GIT_DEP_PREPARE_NOT_ALLOWED or ERR_PNPM_IGNORED_BUILDS; dsh prints the exact key to add under allowBuilds in your profile’s pnpm-workspace.yaml, and the install works on the next run. Allowing a build is a trust decision: only install sources you trust, and pin a commit (github:owner/repo#sha).
README
A DeepSeek Harness (DSH) plugin that shows how much of your Claude and Codex plan limits you have used:
an omp-style line in the terminal client (dst, dsh-TUI) and a ring meter in dsh web. The product and
technical specification is SPEC.md; the test plan and evidence are in TESTING.md.
What it shows
dst. One coloured line above the prompt, on the first screen (Launchpad) and in chat, in the format of Jake's omp line:
Claude (proxy) 5h ░░░░░░░░ 1% ↻2h29m 7d ██░░░░░░ 29% ↻5d6h Codex (proxy) 7d █░░░░░░░ 12% ↻3d11h
Each account shows its 5-hour and weekly windows: a bar, the percent used and the time to the reset.
Percents are green below 50%, amber from 50% and red from 80%. A narrow terminal drops the bars, then
the reset times, then shortens names (Claude·px), and finally shows only the fullest window. A refresh
that fails keeps the last numbers and marks the account stale. Nothing shows until data arrives.
dsh web. A small ring and label beside the composer's context meter in a session, for example
Codex (proxy) 7d 52%: the fullest 5-hour or weekly window, coloured by the same thresholds. Click it for a
panel that lists every window of every account, including per-model windows such as Weekly · Fable
and extra Codex limits, with reset times and stale or error notes.

Where the data comes from
Accounts, in display order:
| Account | Source |
|---|---|
Claude (proxy), Codex (proxy) |
ProviderProxy: GET <baseURL>/usage/claude and /usage/chatgpt with the proxy client key from PROVIDERPROXY_API_KEY (or proxy.apiKeyEnv) |
Claude, Codex |
DSH's own sign-ins (llm-pi-ai/anthropic, llm-pi-ai/openai-codex) → https://api.anthropic.com/api/oauth/usage, https://chatgpt.com/backend-api/wham/usage |
An account that is not configured is left out. The plugin never refreshes, writes or logs tokens; an
expired sign-in waits for DSH to refresh it. ProviderProxy accounts are read at most once a minute (the
proxy caches its upstream for a minute); direct sign-ins at most every minIntervalMs (default 5 minutes,
never below 1 minute), with back-off after errors. dst asks every minute and redraws reset times every
30 seconds without a request; the web page polls the plugin's route every minute.
Install
Both rows are generated by nix-config (home/dsh.nix); by hand they are:
# ~/.dsh/profiles/web/cordis.patch.yml
- insert:
    - id: usage-limits
      name: /path/to/dsh-usage-limits/index.js
      config: &usage
        minIntervalMs: 300000
        proxy:
          baseURL: http://gpu.tail47033e.ts.net:4000/v1
          apiKeyEnv: PROVIDERPROXY_API_KEY
# ~/.dsh/profiles/dsh-tui/cordis.patch.yml
- insert:
    - id: usage-limits
      name: /path/to/dsh-usage-limits/tui.js
      config: *usage
name must point at the entry file (index.js or tui.js), not the package directory. DSH finds the
browser half through package.json. dsh-TUI 0.14.0 draws plugin status lines only in chat; the patch in
patches/ (applied by nix-config's pkgs/dsh-tui.nix) puts them on the Launchpad too. dsh web loads the
plugin when dsh-web starts; dst loads it in each new process.
Test
npm ci
npm test                                   # properties, host runtime, contracts, smoke
DSH_TUI_DIR=<patched dsh-tui> npm run test:e2e:tui   # real dst in tmux
npm run test:e2e:web                       # real dsh web in Playwright
Links
More in this category
bowenliang123/dsh-context★ 3973
DSH context insight panel: Context dashboard + /context command + Context browser — one-stop context lifecycle management with categorized composition, content details, evolution trends, compaction/injection events, and stats.
Han-1413141/dsh-cost-meter★ 597
Per-session and daily API cost, budget with usage %, official balance, history dashboard, and one-click official price sync with peak/off-peak pricing.
wssfk12138/dsh-damage-pulse★ 282
Tracks DeepSeek token usage, per-call and session costs, and account balance with cache-aware charge animations in the DSH Web UI.
zh667/TokenLedger★ 202
Sidebar usage panel that attributes tokens to the relay site that served each request, read from your existing provider config: today/month/all-time totals, per-site and per-model breakdowns, a year activity heatmap, and New API / Sub2API / DeepSeek balances.
Ychris12138/dsh-usage-stats★ 187
Multi-provider usage dashboard with provider/model token breakdowns, calendar drill-downs, account balances, and OpenCode Go / Z.ai subscription quota tracking.
PolinniZhong/dsh-personal-center★ 115
Personal center for DeepSeek Harness: cross-session usage statistics with per-provider and per-model breakdown (auto-discovers configured models), per-model cost estimation, global custom instructions, a data-driven desktop pet with bitmap & vector skins, and a conversation status overview, all local and offline.
Community comments
Comments are public GitHub Discussions. Loading them connects to GitHub and Giscus; a GitHub account is required to post.