Detailed model usage and cost analysis, with per-session usage stats and usage queries for GLM, MiniMax, OpenCode Go, DeepSeek and more.
Install
# from npm (prebuilt)
dsh plugin --profile web add @laoyuehanni/dsh-token-usage
# from GitHub (first run asks for allowBuilds approval — follow the hint, retry)
dsh plugin --profile web add github:LaoYueHanNi/dsh-token-usage
Any plugin you install runs third-party code with your own permissions — it can read your files, use your credentials, and reach the network, and tool approvals don’t sandbox it. GitHub-sourced plugins also run build scripts at install time — pnpm blocks those until you allow them, so an install can stop with ERR_PNPM_GIT_DEP_PREPARE_NOT_ALLOWED or ERR_PNPM_IGNORED_BUILDS; dsh prints the exact key to add under allowBuilds in your profile’s pnpm-workspace.yaml, and the install works on the next run. Allowing a build is a trust decision: only install sources you trust, and pin a commit (github:owner/repo#sha).
README
简体中文 | English
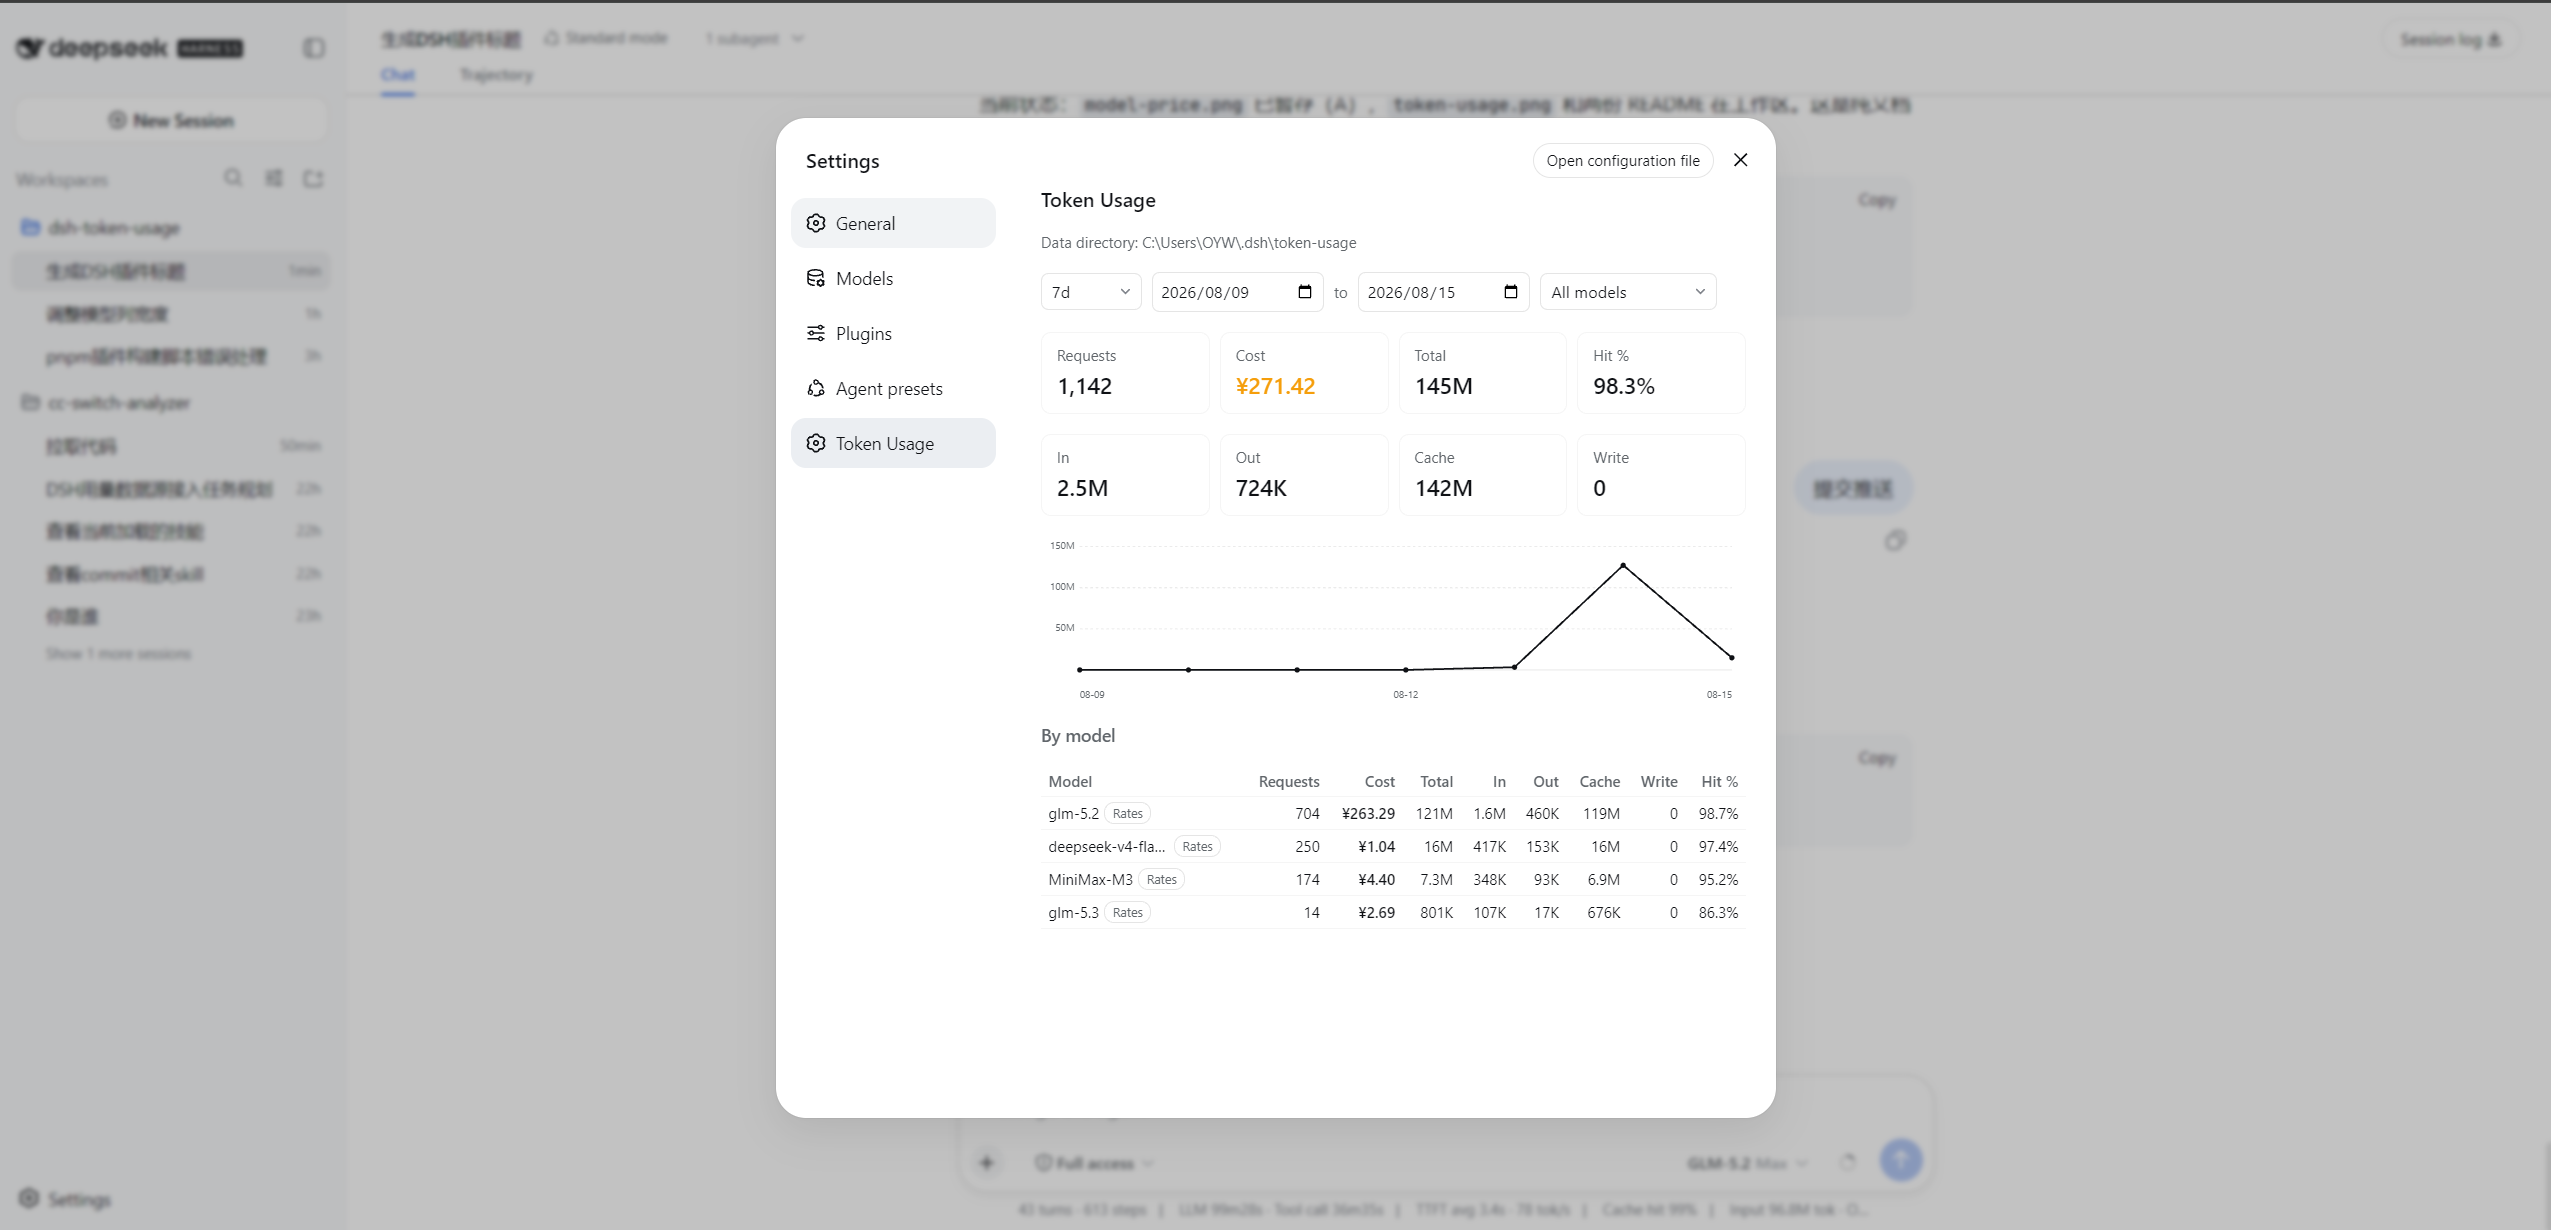
A dsh usage plugin that displays model token usage right in the Web UI. After installation, open Settings (the gear icon in the sidebar) and you'll find the Token Usage page — summary cards (with cost), a daily total-token line chart, a per-model / per-session breakdown, and per-model pricing dialogs, all filterable by date range and model, exactly as shown in the screenshot above.
Repo: https://github.com/LaoYueHanNi/dsh-token-usage
[!IMPORTANT] GitHub direct installs have ended — the repository no longer carries prebuilt output. Install from npm instead:
dsh plugin --profile web add @laoyuehanni/dsh-token-usageUpgrading from a legacy
github:install (≤ 0.3.7, package namedsh-token-usage)? An in-placeupdatefails to load — remove the old name first, then add again. Usage data under$DSH_HOME/token-usage/carries over untouched.
Features
- Live recording: every provider-billed model call is recorded as it happens — tokens, cost, model, session — context-compaction calls included.
- Web stats page: filters (date range + model +
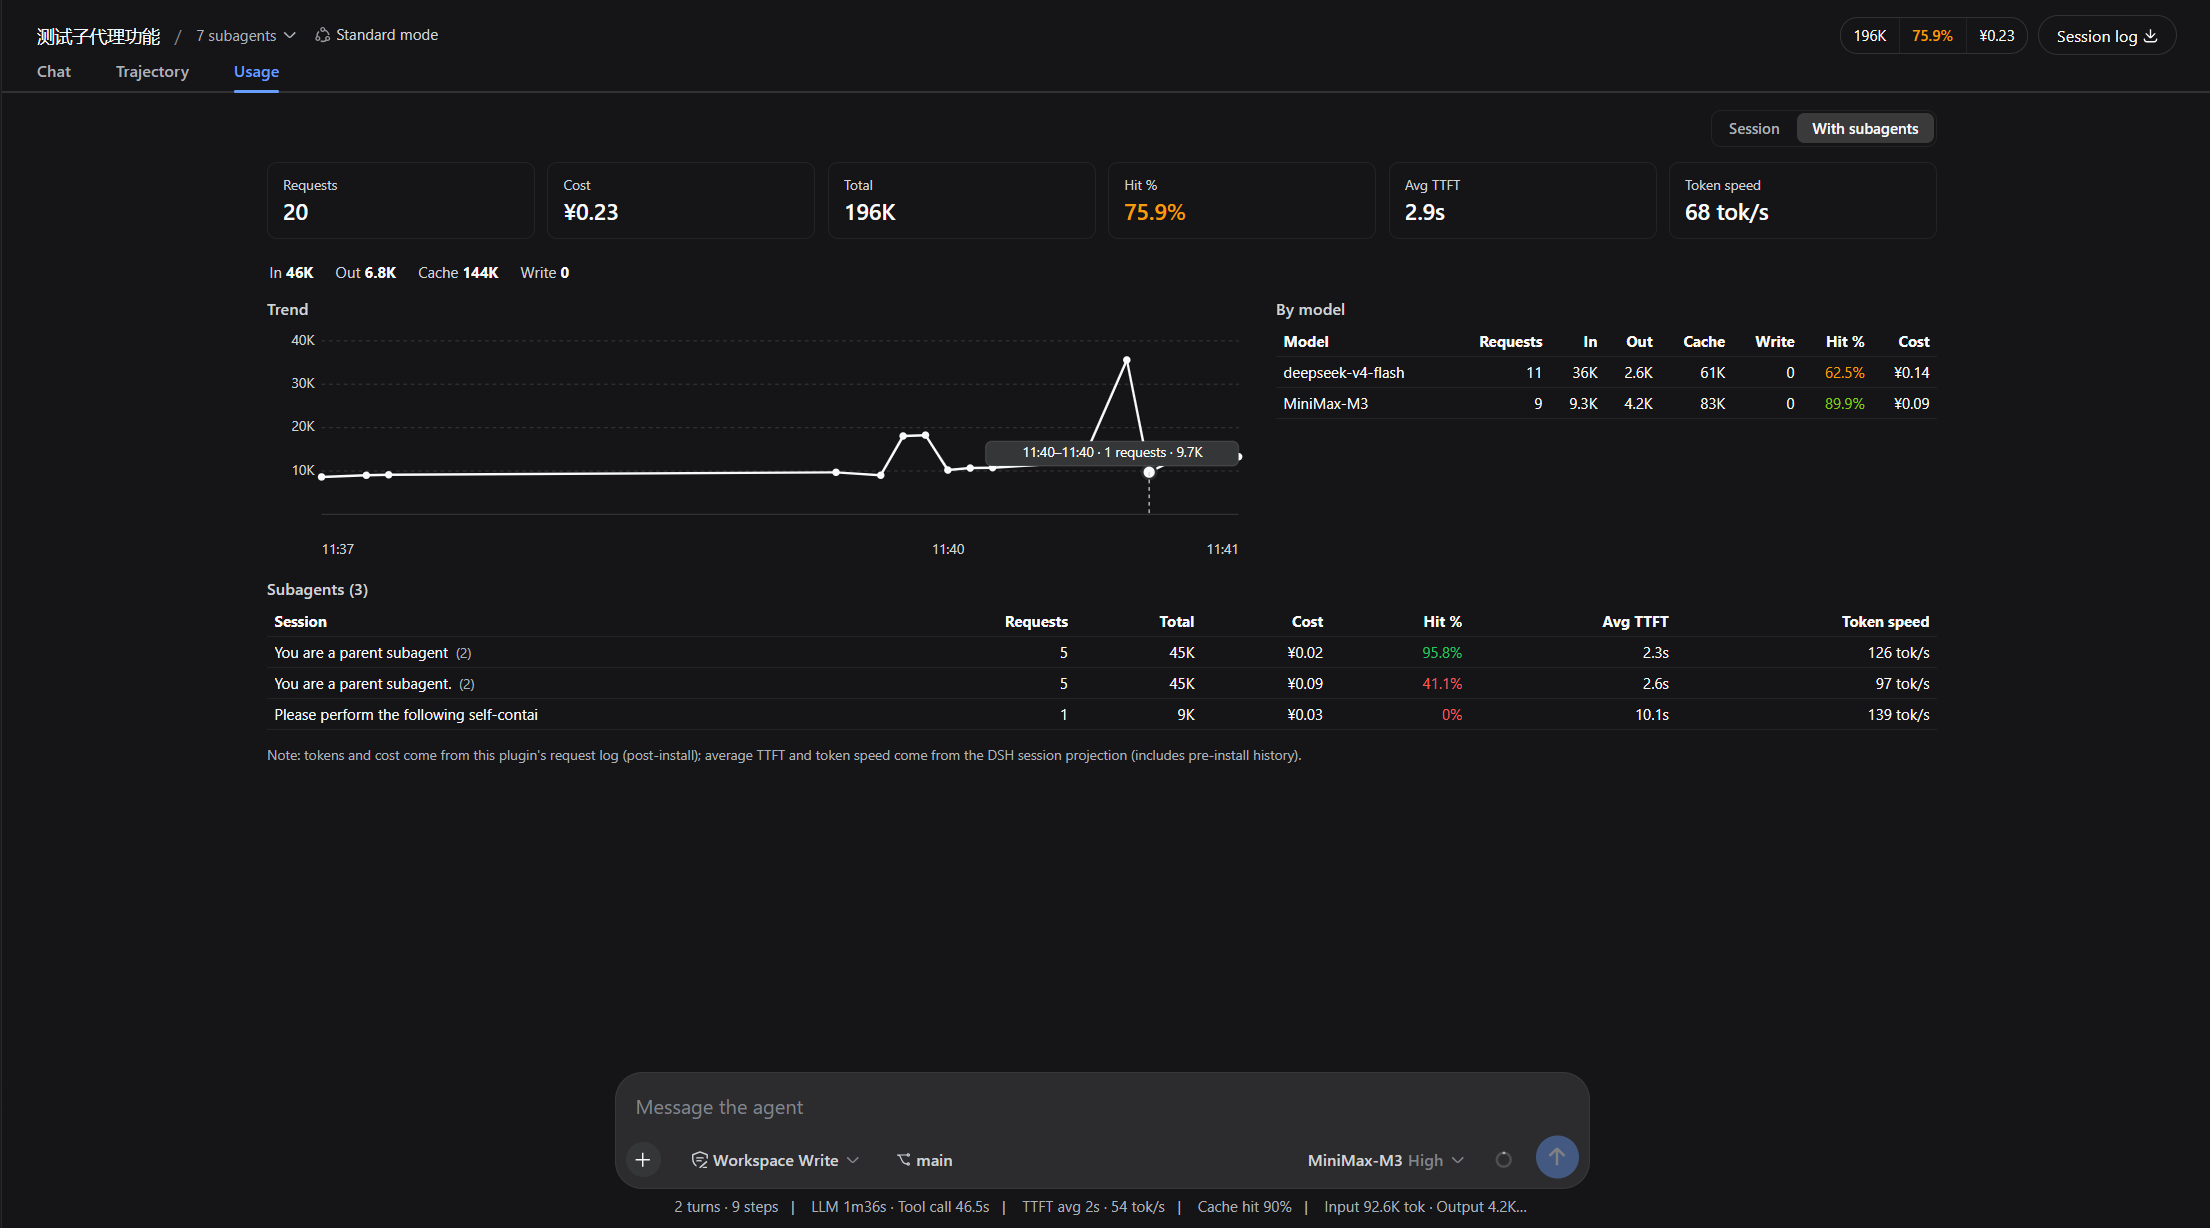
1d/7d/30dshortcuts), summary cards, daily trend chart (hover a day for its total), per-model table. The table block toggles between per-model / per-session: the session table groups by working directory (switchable to a flat list), sorts by total tokens / cost / recent activity on header click, and Ctrl+click on a session row jumps straight to that session's usage tab. - Session usage tab: the conversation pane gains a Usage view tab (beside Chat / Trajectory) with the active session's dashboard — six stat cards (successful requests with a failure pill, cost, cache hit rate, average time-to-first-token, generation throughput, total tokens), a 4-bucket token strip, an hourly trend chart, and a per-model table. A scope switch toggles Session / With subagents, and the subagent table drills into each child and back. Hovering the failure pill breaks failures down per class (rate limited, server error, context exceeded, …).
- Cost figures & model pricing: per-request cost is computed live from per-model rates (¥ per million tokens); unpriced models warn and count as ¥0. Every priced model's name carries a rates button opening its full price table, and the filter row carries a pricing table entry opening an overview of every model in the cloud feed — searchable, with simulated billing and expandable effective rates. Rates sync from the cloud feed on every startup — see Model pricing.
- Provider quota: an input-bar button (left of the model chip) shows the selected provider's remaining quota. See Provider quota.
- History backfill: the first startup syncs requests that happened before installation (idempotent); unreadable session logs are skipped and counted, never fatal to the sync.
Model pricing
Costs are billed per record at its own timestamp, and a rates update re-prices the whole history instantly. The single source is a cloud mirror auto-synced on every startup — pricing corrections belong upstream in the model-price-table feed, so every user benefits at once. A hand-edited pricing.json is no longer read; if you maintain one it is silently ignored after upgrading (the file is left on disk). Upgrading from 0.4.1 or earlier to 0.4.2 triggers a one-time full rebuild of the usage rollup the first time the stats page is read — the larger the history, the longer it takes; this is expected. Broken mirrors degrade the affected models to unpriced without breaking the stats page. Default location: ~/.dsh/token-usage/. Billing rule chain, cloud feed format, and self-hosted mirror URLs: docs/pricing.md.
Configuration
Data directory
Editable on the web card (Settings → Plugins → Token Usage): saving an absolute path takes effect immediately — history migrates automatically, no restart, no manual move. Blank keeps the default ~/.dsh/token-usage/. A save is refused while a conversation is in progress; wait for it to end, then save again. Or set it directly:
plugins:
  token-usage:
    path: D:/data/token-usage   # default: ~/.dsh/token-usage/
Pricing region
The pricing mirror follows your region: Gitee by default (fast inside mainland China) or the GitHub mirror of the same table — pick once on the web card's Pricing region dropdown or via config. The pick also drives the display currency (¥ RMB vs $ USD at the table's exchange rate).
plugins:
  token-usage:
    pricingRegion: overseas   # default: domestic
Provider quota
The input-bar button follows the currently selected provider and opens a panel with remaining quota (the same API key as inference):
| Provider | Shows |
|---|---|
| Zhipu GLM Coding Plan (CN / international) | 5-hour, weekly (some plans also monthly) |
| Kimi For Coding | 5-hour, weekly |
| MiniMax Coding Plan (CN / international) | 5-hour, weekly |
| OpenCode Go | 5-hour, weekly, monthly |
| DeepSeek (official) | ¥ account balance |
| OpenRouter | $ remaining credits |
Unsupported providers hide the button; a failed query can be retried from the panel. On by default; turn it off with quota.enabled: false. Not supported yet: Volcengine, ZenMux, Zhipu Team plan, Claude / Codex / Gemini / Grok official subscriptions, GitHub Copilot.
Install
dsh plugin --profile web add @laoyuehanni/dsh-token-usage
The package declares
dsh.bundle, soaddwires the plugin into the profile automatically — installs work out of the box, and the first startup backfills pre-install history.
Update
dsh plugin --profile web update @laoyuehanni/dsh-token-usage
Remove
dsh plugin --profile web remove @laoyuehanni/dsh-token-usage
Data files under $DSH_HOME/token-usage/ are kept — delete them manually if you no longer need them.
Development
Build once, install a symlink, iterate:
pnpm install
pnpm build:all
pnpm test                # vitest
dsh plugin --profile web add link:D:/plugins/dsh-token-usage
Rebuild and restart dsh web to apply changes (pnpm watch:client in the plugin directory hot-reloads the client). No prepare script by design — lib/ never enters the repo; pnpm publish builds it fresh into the tarball.
Temporary host-only mount (this launch only, no profile changes): copy cordis.example.yml to cordis.yml, point name at the absolute file:// URL of your lib/index.js, then dsh web --patch <plugin-dir>/cordis.yml. Data recording works in this mode; for UI work use the link: install above.
Links
More in this category
bowenliang123/dsh-context★ 1550
DSH context insight panel: Context dashboard + /context command + Context browser — one-stop context lifecycle management with categorized composition, content details, evolution trends, compaction/injection events, and stats.
Han-1413141/dsh-cost-meter★ 340
Per-session and daily API cost, budget with usage %, official balance, history dashboard, and one-click official price sync with peak/off-peak pricing.
wssfk12138/dsh-damage-pulse★ 211
Tracks DeepSeek token usage, per-call and session costs, and account balance with cache-aware charge animations in the DSH Web UI.
zh667/TokenLedger★ 203
Sidebar usage panel that attributes tokens to the relay site that served each request, read from your existing provider config: today/month/all-time totals, per-site and per-model breakdowns, a year activity heatmap, and New API / Sub2API / DeepSeek balances.
Ychris12138/dsh-usage-stats★ 164
Multi-provider usage dashboard with provider/model token breakdowns, calendar drill-downs, account balances, and OpenCode Go / Z.ai subscription quota tracking.
PolinniZhong/dsh-personal-center★ 120
Personal center for DeepSeek Harness: cross-session usage statistics, per-model cost estimation, global custom instructions, a global font-size adjuster, a data-driven desktop pet with bitmap & vector skins, and a conversation status overview, all local and offline.
Community comments
Comments are public GitHub Discussions. Loading them connects to GitHub and Giscus; a GitHub account is required to post.