Floating Token Burn Dock for DSH that aggregates provider usage across every session: the collapsed capsule shows the live tokens/sec rate with an inline 60-second sparkline and today's total, while the expanded panel adds a large live-rate hero, per-model and per-hour breakdowns on a real left axis, and a 30-day commit-style heatmap. The sequence-frame flame burns only while tokens are actually flowing and goes out at rate 0; day and hour buckets follow the browser's UTC offset instead of the host process timezone, and the 31-day record store is written atomically after history load so a restart no longer wipes the numbers.
Install
# from npm (prebuilt)
dsh plugin --profile web add dsh-plugin-token-burned
# from GitHub (first run asks for allowBuilds approval — follow the hint, retry)
dsh plugin --profile web add github:yuna78/dsh-plugin-token-burned
Any plugin you install runs third-party code with your own permissions — it can read your files, use your credentials, and reach the network, and tool approvals don’t sandbox it. GitHub-sourced plugins also run build scripts at install time — pnpm blocks those until you allow them, so an install can stop with ERR_PNPM_GIT_DEP_PREPARE_NOT_ALLOWED or ERR_PNPM_IGNORED_BUILDS; dsh prints the exact key to add under allowBuilds in your profile’s pnpm-workspace.yaml, and the install works on the next run. Allowing a build is a trust decision: only install sources you trust, and pin a commit (github:owner/repo#sha).
README
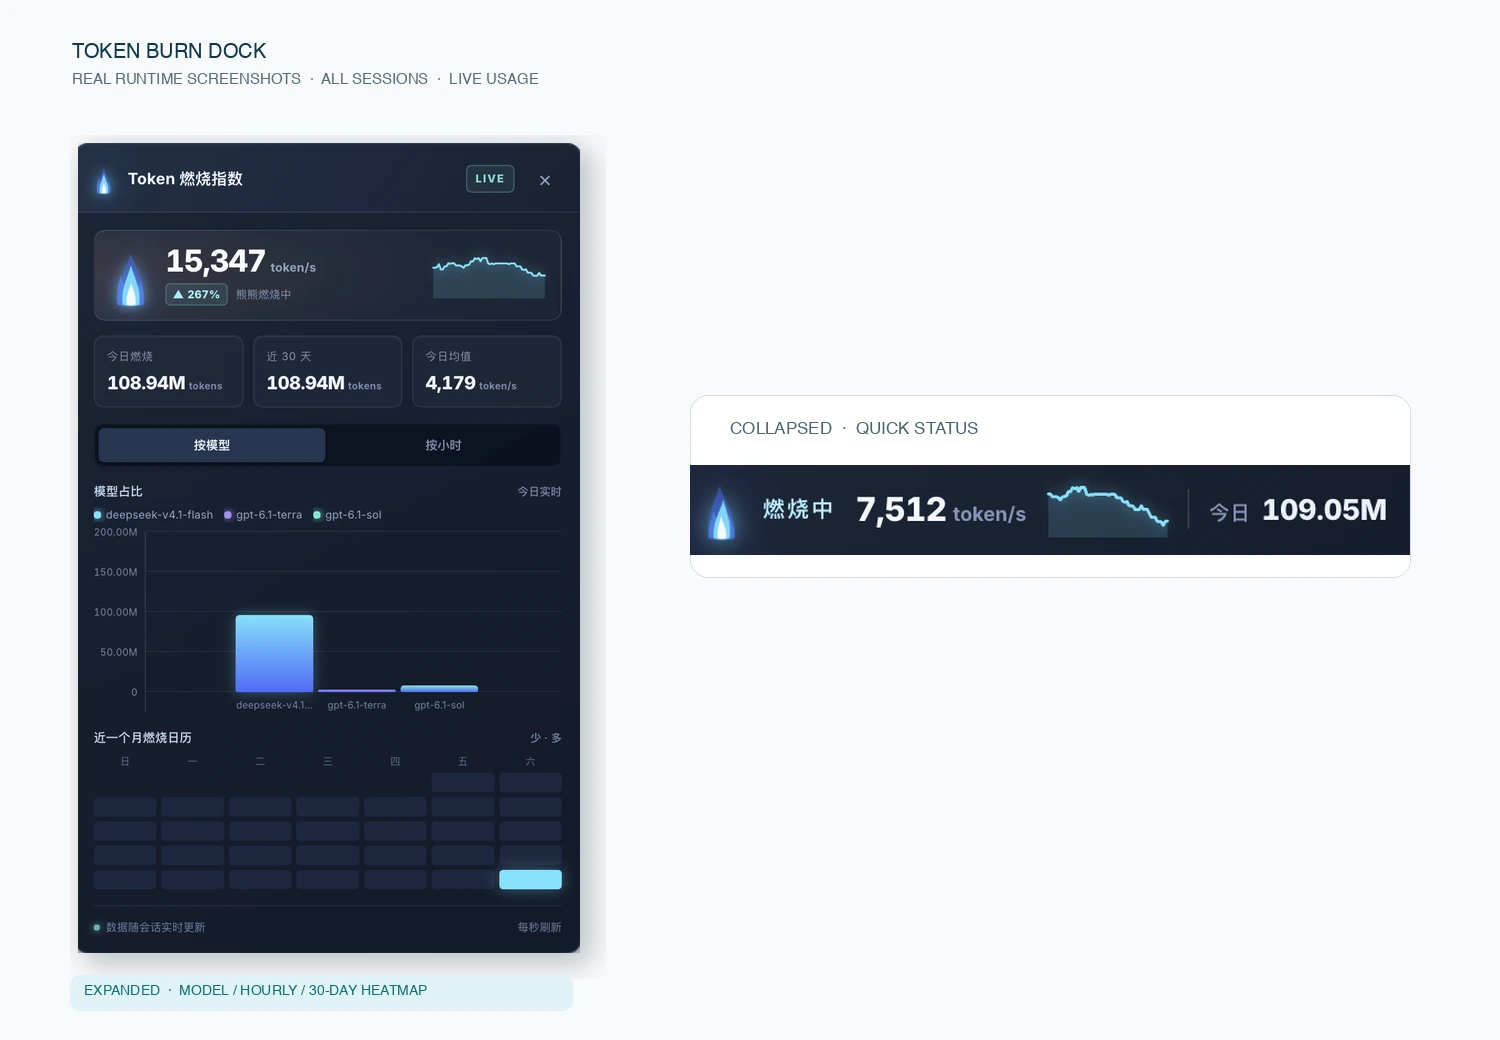
Expanded panel on the left; the collapsed capsule on the right. A real runtime screenshot, not a mockup.
Turn tokens into a fire you can see.
A floating Token Burn Index dock for DeepSeek Harness (DSH): every session's usage folded into one fire you can watch — one glance tells you how hot it is.
Install · 7 burn tiers · Feedback · 中文
Why install it
- Know how hot it burns at a glance. The collapsed capsule shows the current burn tier (星火 → 爆燃), the live
token/s, a 60-second rate curve and today's total — no expanding, no clicking. - Seven tiers, from a single spark to a full fire wall. Every tier is its own 16-frame procedurally generated SVG with its own palette, glow, flicker speed and tongue layout, growing from one small flame into a full-width wall of fire; all of it is code, with no image assets. With no new burn it settles into a static, desaturated icon.
- No jitter, no tier-hopping. It climbs fast (~0.3s) and falls slow (~0.9s), so a wobbly rate keeps the flame steady at its current tier.
- The detail is there when you want it. Expand to switch between per-model and per-hour bars with a real left axis whose ticks ease upward as the data max grows, plus a 30-day heatmap and a 7-segment burn-tier progress bar.
- Numbers you can trust, nothing lost on restart. Usage is aggregated across every session; days and hours bucket by the browser's timezone; 31 days of records are written atomically so a restart never wipes them.
- Out of your way. The dock is draggable and remembers its position;
prefers-reduced-motionis honored; usage is read locally from DSH and never uploaded.
Burn tiers
Tiers are picked by absolute token/s cut-offs — the rate is stable and predictable: around 20k/s is 火海 (Inferno), and only 50k/s and up is 爆燃 (Detonation).
The live rate counts all provider-usage tokens: input + cache read/write + output. Cache reads usually dominate, so a normal coding session already runs at 10k–30k token/s — that is not an anomaly. 7 burning tiers plus 已熄灭:
| Tier | Live rate (token/s) | Flame | One-liner |
|---|---|---|---|
| 1 星火 (Spark) | < 100 | single small tongue, slow flicker | 一星火苗,刚点着 — a lone spark, just lit |
| 2 小火 (Low) | 100 – 500 | tongue + inner core | 小火慢烧,稳稳的 — a low, steady burn |
| 3 中火 (Medium) | 500 – 2,000 | twin outer tongues | 火势上来了 — it's building up |
| 4 大火 (High) | 2,000 – 3,000 | three tongue layers + bright inner flame | 三丛火舌,呼呼作响 — three tongues roaring |
| 5 烈火 (Blaze) | 3,000 – 9,000 | wide fire body + many tongues | 一团烈火,烧穿屏幕 — a blaze burning through the screen |
| 6 火海 (Inferno) | 9,000 – 50,000 | three clusters + bottom fire wall + embers | 好多丛火,连成一片 — clusters merging into one |
| 7 爆燃 (Detonation) | ≥ 50,000 | full-width fire wall + many tongues + embers | 整面火墙,全屏爆燃 — the whole screen detonates |
With no new burn it shows 已熄灭 (a static, desaturated icon).
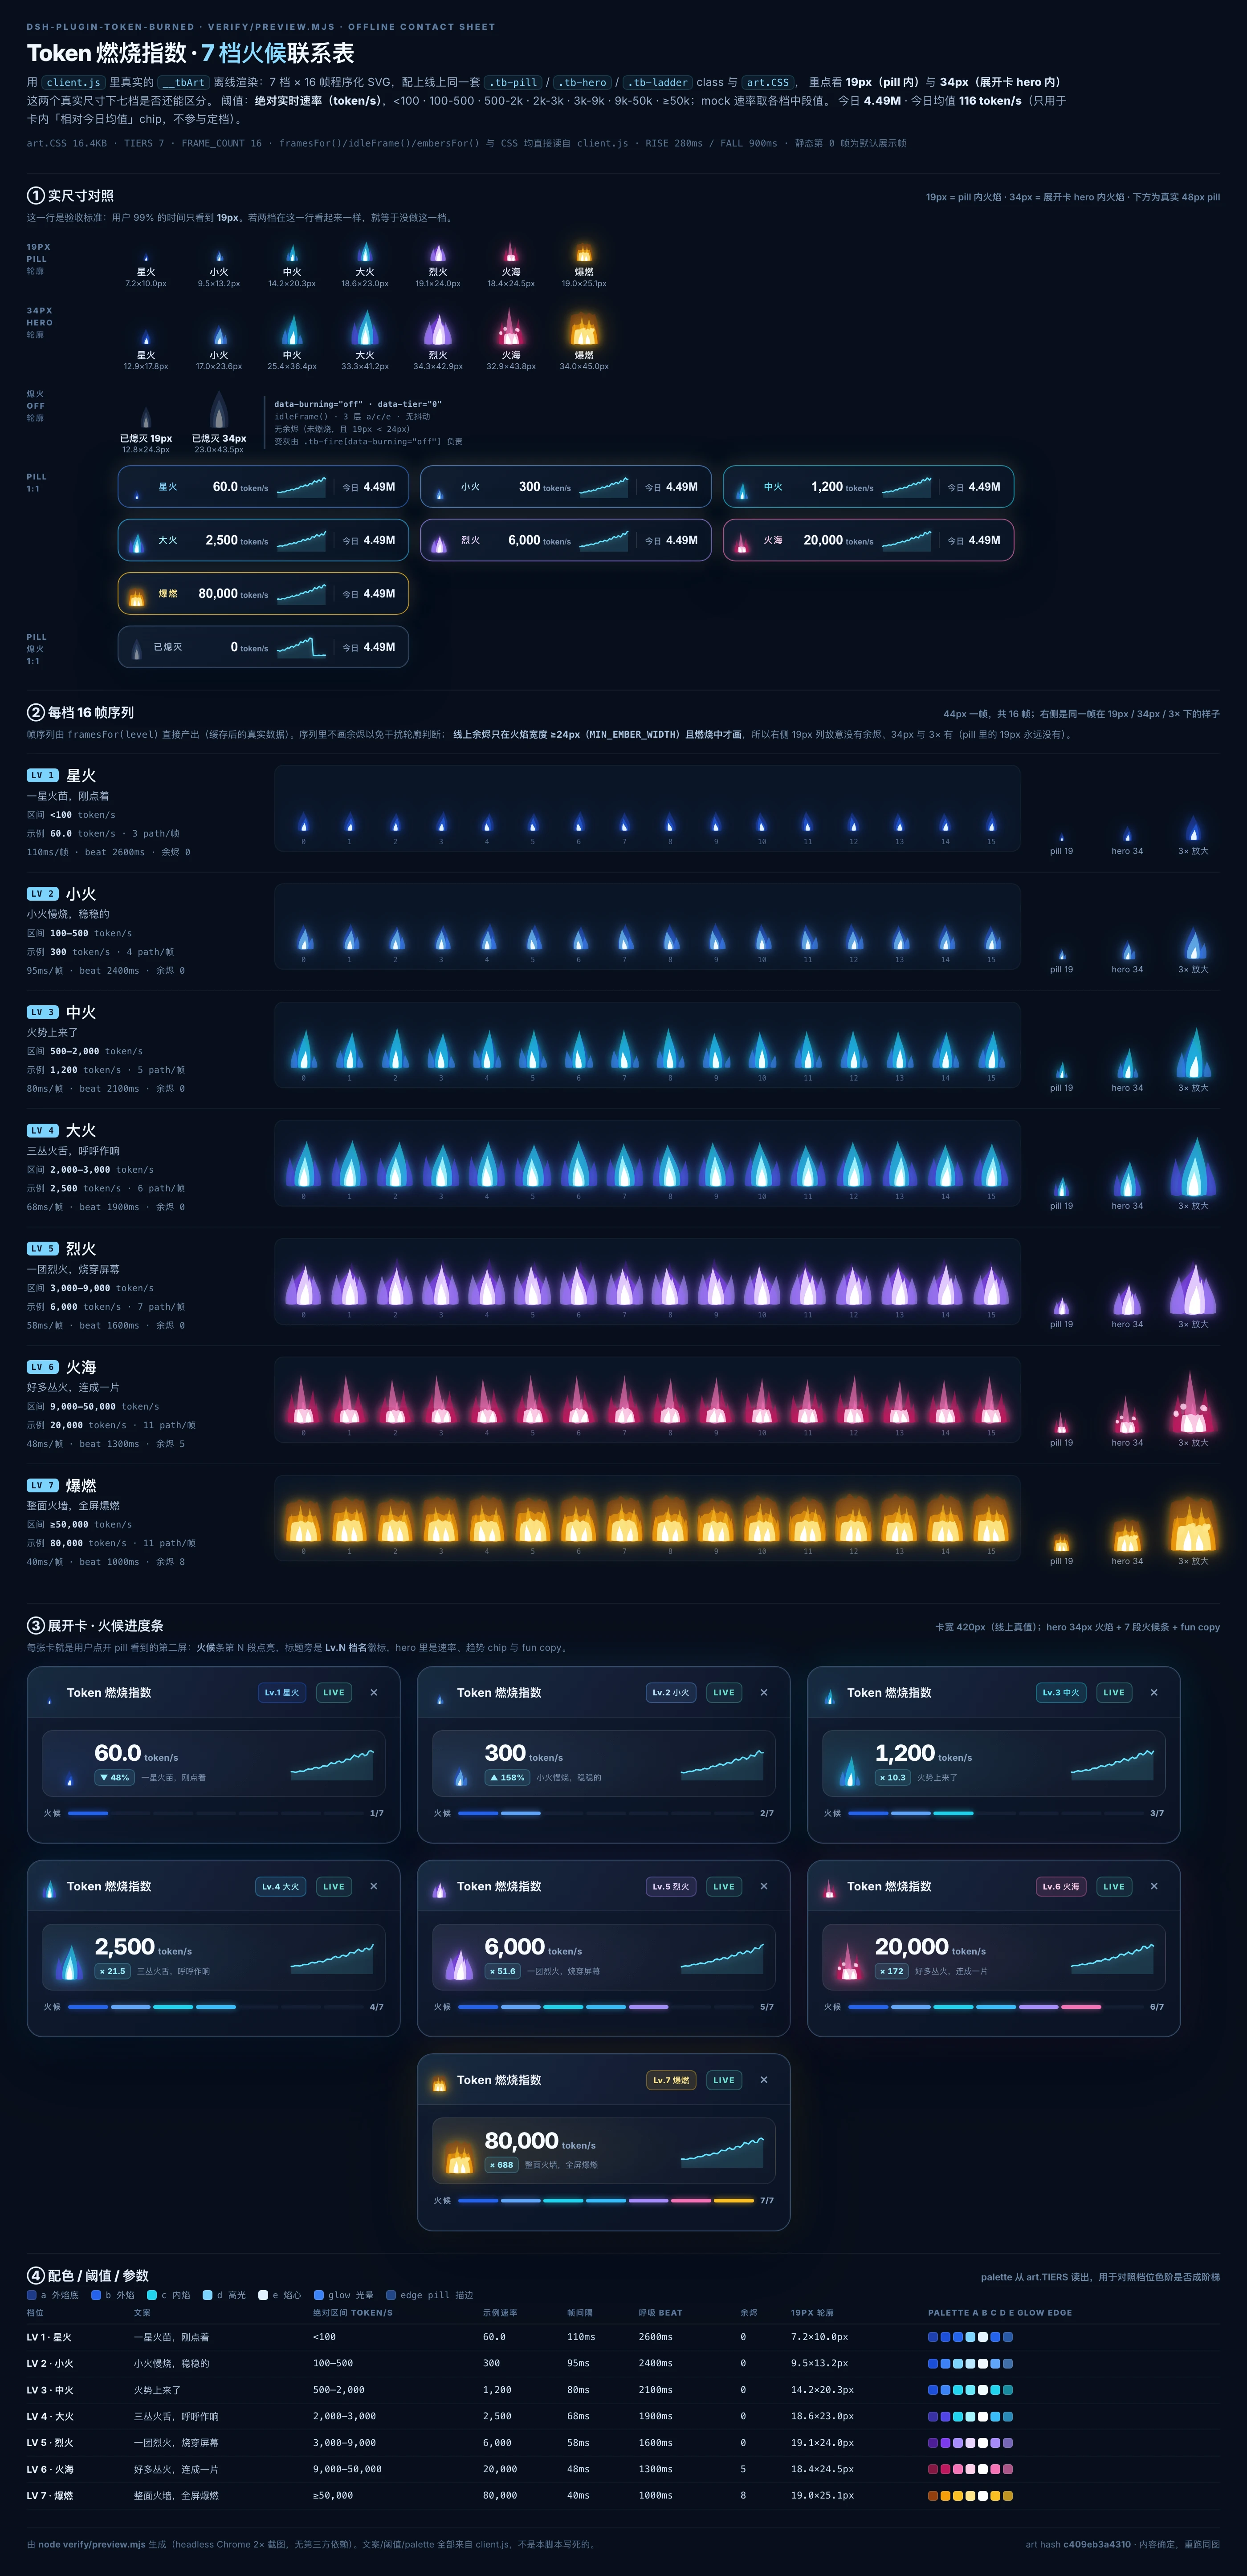
Generated offline by
npm run previewfrom the realclient.jsart layer (no image assets); 19px is the actual capsule size.
Most of the time you are looking at that 19px flame in the capsule — which is why every tier gets its own 16 frames.
What's in the panel
Expanded, top to bottom:
- Hero row: the large live rate, a chip comparing it to today's average, and a 60-second rate sparkline.
- Two tabs: per-model / per-hour; bars sit on a real left axis whose tick labels ease upward as the data max grows, with smoothly transitioning heights.
- 30-day heatmap: aligned to real weekdays, shaded by relative intensity.
- 7-segment burn-tier progress bar: the current tier plus that tier's one-line copy.
- LIVE / OFFLINE status: whether it is actually burning, stated right on the panel.
Data
The plugin aggregates observable assistant/message provider usage across all sessions. Totals include input, cache read/write, and output tokens. It never fabricates billing data when usage is unavailable.
- "Today" and "which hour" follow the browser's timezone. The client passes its UTC offset (
?off=, minutes) to the host, which buckets days and hours with that fixed offset. A host process running underTZ=UTCused to bucket by its owngetHours(), so bars landed under the wrong hour labels. - Persistence is atomic and load-ordered. State lives in
storages/dsh-token-burned.json(write.tmp, thenrename), and a write always waits for history to finish loading. The old code could have a restarted process overwrite the file with a Map that held only the newest event, wiping all earlier records. - Entries are retained for 31 days and aggregated over a 30-day window; anything older is pruned at load time.
Install
Search for it in the DSH plugin installer:
dsh-plugin-token-burned
Refresh the page after installing — no restart needed.
Development
npm install
npm test
Backfill usage history
Releases before 0.2.0 lost their state file on every restart, so some history days are missing. You can rebuild them once from the local session transcripts:
npm run backfill            # report only (dry-run by default)
npm run backfill -- --write # write the baseline file, then restart DSH
It only writes ~/.dsh/storages/dsh-token-burned.baseline.json (~30 numbers, under 1 KB) and never touches the state file; today's numbers always come from live events and are never overwritten by a backfill.
Releasing
Releases are published manually by a maintainer (no CI publish job). A release = version bump + CHANGELOG + tag + GitHub Release + npm publish.
Clean tree: no uncommitted changes and
npm testgreen (prepublishOnlyre-runs it anyway).CHANGELOG: add
## [x.y.z] — YYYY-MM-DDat the top, grouped as Added / Changed / Fixed.Bump and tag (the
vprefix matches the version):npm version patch --no-git-tag-version # or minor / major git add package.json CHANGELOG.md README.md README.en.md git commit -m "chore(release): x.y.z" git tag -a vx.y.z -m "x.y.z" git push && git push --tagsCheck the tarball (pack only, do not publish yet):
npm pack --dry-run
npm pack --pack-destination dist
Only the 9 files in the
fileswhitelist should be inside (index.js,client.js,cordis.patch.yml,icon.svg,README.md,README.en.md,CHANGELOG.md,LICENSE,package.json) — around 27 kB.verify/and the largedocs/images are git-only.GitHub Release: pick tag
vx.y.zand paste the matching CHANGELOG section. The contact-sheet image in the READMEs loads fromraw.githubusercontent.com/.../main/docs/preview-tiers.webp, so push before creating the Release or the image will 404 on the npm page.Publish (npm 2FA required):
npm publishVerify after publish:
npm view dsh-plugin-token-burned version dist.tarball
npm pack dsh-plugin-token-burned@x.y.z --pack-destination /tmp
tar tzf /tmp/dsh-plugin-token-burned-x.y.z.tgz
Published versions are immutable — a mistake needs a new patch release.
prepublishOnlyis bound tonpm test, so even a forgotten test run is caught by smoke / baseline / tiers before anything is uploaded.
License
MIT
Install it — then, before you log off, see how much you burned today.
Links
More in this category
bowenliang123/dsh-context★ 3973
DSH context insight panel: Context dashboard + /context command + Context browser — one-stop context lifecycle management with categorized composition, content details, evolution trends, compaction/injection events, and stats.
Han-1413141/dsh-cost-meter★ 597
Per-session and daily API cost, budget with usage %, official balance, history dashboard, and one-click official price sync with peak/off-peak pricing.
wssfk12138/dsh-damage-pulse★ 282
Tracks DeepSeek token usage, per-call and session costs, and account balance with cache-aware charge animations in the DSH Web UI.
zh667/TokenLedger★ 202
Sidebar usage panel that attributes tokens to the relay site that served each request, read from your existing provider config: today/month/all-time totals, per-site and per-model breakdowns, a year activity heatmap, and New API / Sub2API / DeepSeek balances.
Ychris12138/dsh-usage-stats★ 187
Multi-provider usage dashboard with provider/model token breakdowns, calendar drill-downs, account balances, and OpenCode Go / Z.ai subscription quota tracking.
PolinniZhong/dsh-personal-center★ 115
Personal center for DeepSeek Harness: cross-session usage statistics with per-provider and per-model breakdown (auto-discovers configured models), per-model cost estimation, global custom instructions, a data-driven desktop pet with bitmap & vector skins, and a conversation status overview, all local and offline.
Community comments
Comments are public GitHub Discussions. Loading them connects to GitHub and Giscus; a GitHub account is required to post.