Token usage dashboard for the DSH web GUI — today/week/month totals, per-model breakdown and a stacked 30-day chart, with a 4-language UI.
Install
# from GitHub (first run asks for allowBuilds approval — follow the hint, retry)
dsh plugin --profile web add github:phungthien269/dsh-token-stats
Any plugin you install runs third-party code with your own permissions — it can read your files, use your credentials, and reach the network, and tool approvals don’t sandbox it. GitHub-sourced plugins also run build scripts at install time — pnpm blocks those until you allow them, so an install can stop with ERR_PNPM_GIT_DEP_PREPARE_NOT_ALLOWED or ERR_PNPM_IGNORED_BUILDS; dsh prints the exact key to add under allowBuilds in your profile’s pnpm-workspace.yaml, and the install works on the next run. Allowing a build is a trust decision: only install sources you trust, and pin a commit (github:owner/repo#sha).
README
This plugin publishes its README in Chinese only.
Token usage dashboard for the DeepSeek Harness web GUI — displayed directly inside the app. No extra collection: it reads the 365-day local ledger the built-in Wallet plugin already records (every AI call: model, provider, day, input/output/cache tokens, cost when priced).
English · Tiếng Việt · 中文
Features
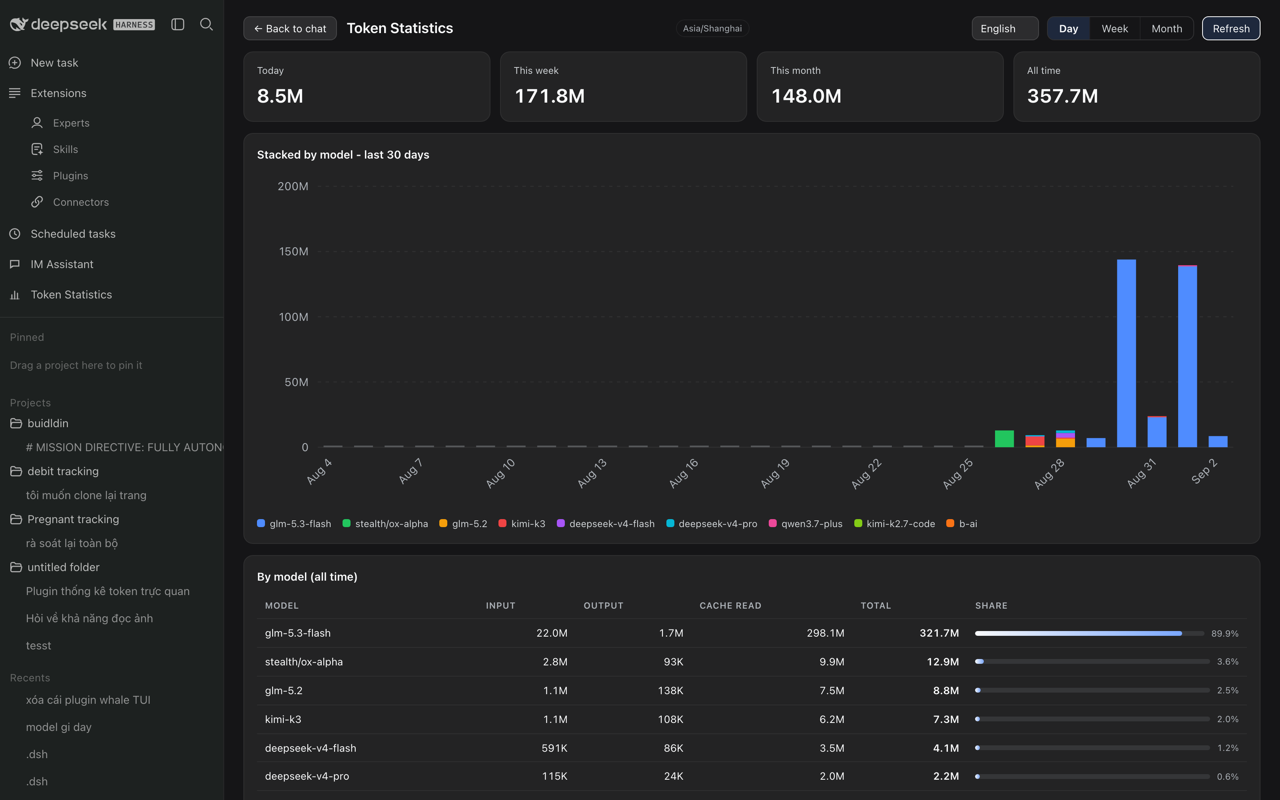
- Sidebar entry "Token Statistics" — opens a full-width dashboard in the center column (same interaction model as the Task Board plugin); works in both the expanded sidebar and the compact rail.
- Four summary cards — Today / This week / This month / All time (tokens + cost when pricing data exists).
- Stacked bar chart — pure SVG, one color per model, daily (30 days) / weekly (12 ISO weeks) / monthly (12 months), hover tooltips per model, K/M-scaled axis.
- Per-model table — input, output, cache read, total, share bar; sorted by total.
- 4-language UI — English (primary), Tiếng Việt, 中文, 日本語. Language picker in the dashboard header; the choice is remembered.
- Auto-refresh — refetches every 30 s while the dashboard is open, plus a manual refresh button.
- Zero dependencies, no build step — host half is plain ESM Node; client half is a single pre-bundled CJS module.
Install
dsh plugin --profile web add dsh-token-stats
Restart dsh web (or use the Market's one-click restart), then look for Token Statistics in the left sidebar.
Requires dsh ≥ 0.1.1-rc.2 (the sidebar DOM it integrates with). Read-only: the plugin never writes to the Wallet ledger.
How it works
- Host half registers
GET /api/token-stats/summary: all-time totals from~/.dsh/storages/wallet.jsonsessions, and day/week/month series from itshistory.events(timezone-aware, mtime-cached). - Client half mounts the sidebar entry (self-healing DOM injection) and the dashboard React view; charts are hand-rolled SVG — no chart library.
Data notes
- All-time totals come from the Wallet session ledger; the day/week/month series come from the Wallet event ledger (capped at 20,000 events / 365 days by the Wallet plugin). Models without pricing show tokens only.
Tiếng Việt
Dashboard thống kê token cho web GUI của DeepSeek Harness — hiển thị trực tiếp trong ứng dụng. Đọc sổ ghi 365 ngày có sẵn của plugin Wallet (mỗi lần gọi AI: model, ngày, token input/output/cache, chi phí khi có). Thẻ tổng quan Hôm nay / Tuần này / Tháng này / Tổng tất cả; biểu đồ cột xếp lớp theo model; bảng chi tiết từng model. Giao diện đa ngôn ngữ: Tiếng Việt, English, 中文, 日本語 — đổi ngay trong dashboard. Cài đặt: dsh plugin --profile web add dsh-token-stats, khởi động lại dsh web, mở mục "Thống kê Token" ở thanh bên.
中文
DeepSeek Harness Web GUI 的 Token 用量仪表盘 — 直接显示在界面内。读取内置 Wallet 插件的 365 天本地账本(每次 AI 调用:模型、日期、输入/输出/缓存 token、可用时的费用)。今日 / 本周 / 本月 / 累计四张汇总卡片;按模型堆叠的柱状图;模型明细表。界面支持越南语 / 英语 / 中文 / 日语,可在仪表盘内切换。安装:dsh plugin --profile web add dsh-token-stats,重启 dsh web,在侧边栏打开 "Token 统计"。
Submit to the Plugin Market
See docs/market-submission.md — publish to npm, then PR one entry into the awesome-dsh-plugin catalog (the Market picks it up automatically, usually within a day).
License
MIT — see LICENSE.
Links
More in this category
bowenliang123/dsh-context★ 2300
DSH context insight panel: Context dashboard + /context command + Context browser — one-stop context lifecycle management with categorized composition, content details, evolution trends, compaction/injection events, and stats.
Han-1413141/dsh-cost-meter★ 459
Per-session and daily API cost, budget with usage %, official balance, history dashboard, and one-click official price sync with peak/off-peak pricing.
wssfk12138/dsh-damage-pulse★ 271
Tracks DeepSeek token usage, per-call and session costs, and account balance with cache-aware charge animations in the DSH Web UI.
zh667/TokenLedger★ 201
Sidebar usage panel that attributes tokens to the relay site that served each request, read from your existing provider config: today/month/all-time totals, per-site and per-model breakdowns, a year activity heatmap, and New API / Sub2API / DeepSeek balances.
Ychris12138/dsh-usage-stats★ 177
Multi-provider usage dashboard with provider/model token breakdowns, calendar drill-downs, account balances, and OpenCode Go / Z.ai subscription quota tracking.
PolinniZhong/dsh-personal-center★ 118
Personal center for DeepSeek Harness: cross-session usage statistics, per-model cost estimation, global custom instructions, a global font-size adjuster, a data-driven desktop pet with bitmap & vector skins, and a conversation status overview, all local and offline.
Community comments
Comments are public GitHub Discussions. Loading them connects to GitHub and Giscus; a GitHub account is required to post.