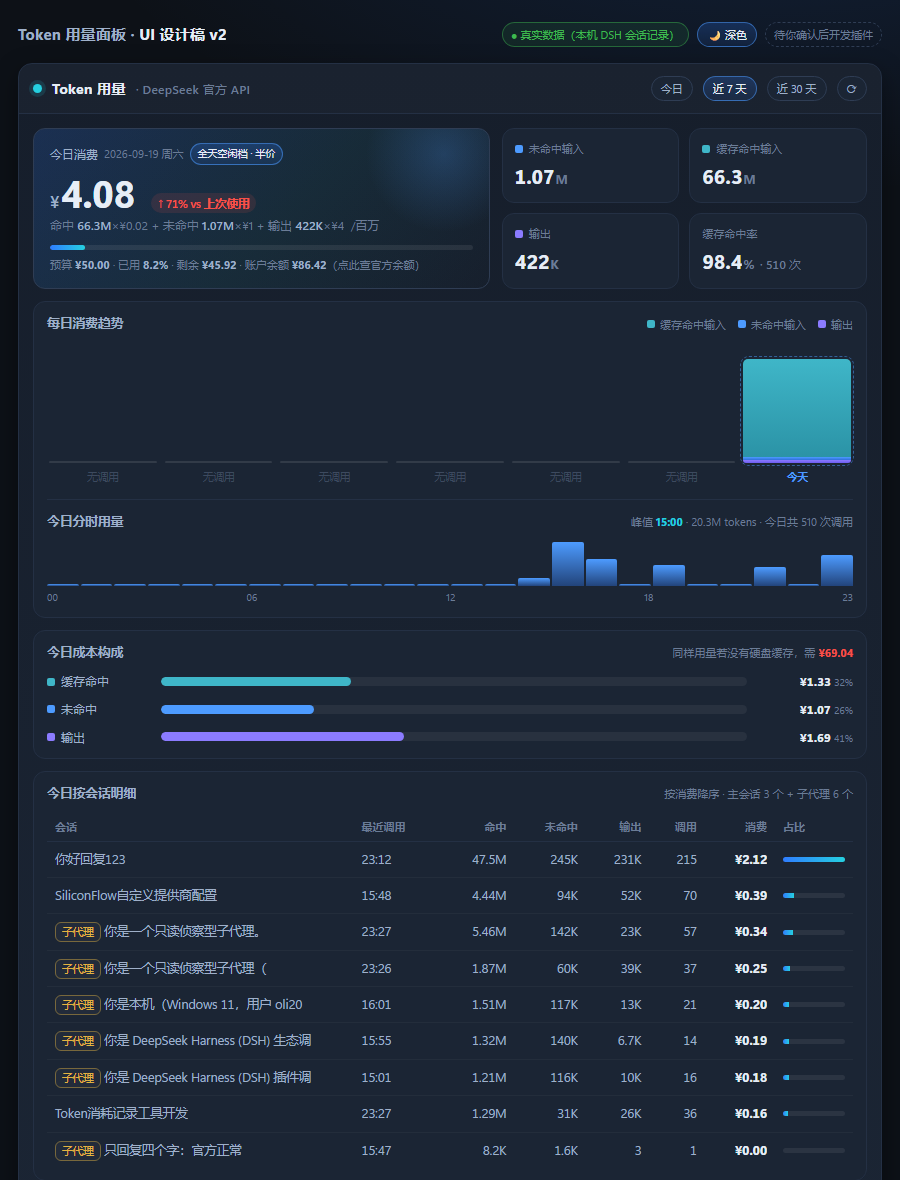
Adds a sidebar panel to the DeepSeek Harness web UI that reports token usage and cost, with today's spend, budget progress, 7-day and 30-day trends, a cost breakdown, cache-hit savings, and a per-session breakdown.
Install
# from a prebuilt release tarball
dsh plugin --profile web add "https://github.com/olimc2016/dsh-token-meter-panel/releases/download/v0.1.0/dsh-token-meter-panel-0.1.0.tgz"
# from GitHub (first run asks for allowBuilds approval — follow the hint, retry)
dsh plugin --profile web add github:olimc2016/dsh-token-meter-panel
Any plugin you install runs third-party code with your own permissions — it can read your files, use your credentials, and reach the network, and tool approvals don’t sandbox it. GitHub-sourced plugins also run build scripts at install time — pnpm blocks those until you allow them, so an install can stop with ERR_PNPM_GIT_DEP_PREPARE_NOT_ALLOWED or ERR_PNPM_IGNORED_BUILDS; dsh prints the exact key to add under allowBuilds in your profile’s pnpm-workspace.yaml, and the install works on the next run. Allowing a build is a trust decision: only install sources you trust, and pin a commit (github:owner/repo#sha).
README
Token usage & cost panel for DSH (DeepSeek Harness). A dedicated sidebar view: how much you spent today, where it went, and how much the disk cache saved you.
中文 | English
This is a community plugin, not an official DeepSeek plugin. It is not affiliated with, endorsed by, or connected to DeepSeek in any way. The project name uses the abbreviation DSH as recommended by the official brand guidelines; "DeepSeek" and "DeepSeek Harness" are trademarks of DeepSeek.
The amounts shown are local estimates, not an official bill. Built-in rates were checked against the official pricing page (capture date below); prices can change at any time — always defer to the official page.
The problem
DSH records per-call token usage in its session logs, but only tokens — no money: the kernel ships no pricing code at all.
This plugin turns usage into what you actually care about:
- How much today (CNY), and how much budget is left
- Where the money went: cached input / uncached input / output
- How much the cache saved: DeepSeek's cache-hit price is 1/50 of a miss
- Which session is burning money: per-session breakdown, subagent sessions tagged
- When it burns: 24-hour distribution with the peak hour marked
Features
| Block | Content |
|---|---|
| Today's spend | Large amount, budget bar, delta vs previous use, account balance (optional) |
| Four metrics | Uncached input / cached input / output tokens, cache hit rate + call count |
| Daily trend | 7 / 30 days, stacked bars by the three token kinds, hover for detail |
| Today by hour | 24-hour token distribution with the peak hour marked |
| Cost breakdown | What each token kind costs, plus "what today would cost without the disk cache" |
| Per-session | Today's tokens, calls and cost per session; subagent sessions tagged |
| Live session | Real-time usage of the current conversation (from the official tokenUsage projection) |
Colors carry fixed meaning (teal = cached input, blue = uncached input, violet = output) and come
from DSH's own --dsw-* theme variables, so the panel matches the shell in both light and dark themes.
Install
Status: not on npm yet (npm account registration in progress). For now install from the GitHub Release tarball.
Option 1 — GitHub Release tarball (available now)
- Download
dsh-token-meter-panel-0.1.0.tgzfrom Releases - Install it:
dsh plugin --profile desktop add ./dsh-token-meter-panel-0.1.0.tgz
Option 2 — npm (once published)
dsh plugin --profile desktop add dsh-token-meter-panel
Option 3 — from source (developers)
git clone https://github.com/olimc2016/dsh-token-meter-panel.git
cd dsh-token-meter-panel
npm install
npm run setup     # local module-resolution links, see Development
npm test
dsh plugin --profile desktop add .
Restart DSH Desktop afterwards — plugin bundles are only resolved at host boot; the
cordis.patch.yml hot reload does not cover them.
A "Token" gauge icon appears at the bottom of the sidebar; click it to open the panel.
Permissions and data boundary: this plugin only reads local session logs, writes no files and runs no commands; the only network access is the account-balance lookup, which you can switch off in Settings for a fully zero-egress setup. See Privacy & permissions.
Pricing model
Costs are estimated from DeepSeek's official pricing — this is not a DSH built-in.
- Available models:
deepseek-flash,deepseek-v4-pro(deepseek-chat/deepseek-reasonerwere retired on 2026-07-24; the olddeepseek-v4-flashname still routes but bills at Flash rates) - Off-peak price = half of peak. Peak = Beijing time Mon–Fri 09:00–12:00 and 14:00–18:00 (public holidays excluded; not modelled here)
- Cache-hit input costs 1/50–1/30 of a miss — the headline number this panel exists to show
reasoningTokensis already insideoutputTokens, never double-counted- Unknown models are never guessed: tokens are counted, money is not. Better one missing number than a wrong one.
- Source: https://api-docs.deepseek.com/quick_start/pricing (rates captured 2026-09-19)
Rates, daily budget, alert threshold, refresh interval and the balance toggle live in Settings → Plugins → token-meter-panel, and take effect immediately.
Where the data comes from
Two sources, combined:
- Full log aggregation — the only source of per-day history.
Scans
$DSH_HOME/sessions/<workspace>/<session>/session[.v3].jsonl.zstd, readsdata.usagefrom everyassistant/message, buckets by Beijing time. - Official projection — the "live session" card reads DSH's
useProjection('tokenUsage').
Three implementation details worth knowing
DSH's .jsonl.zstd files are append-only multi-frame zstd:
zlib.zstdDecompressSync()decodes only the first frame (5.3 MB in, 187 bytes out — measured)zlib.createZstdDecompress()fails after the first frame withUnknown frame descriptor- The working approach is to scan frame boundaries and decode frame by frame
(structurally the same as
scanZstdFramesin@deepseek-ai/dsh-session-persistence-jsonl; seesrc/zstd.mjs)
Two aggregation traps:
- When both
session.jsonl(v0) andsession.v3.jsonlexist for one session, only v3 counts, otherwise usage doubles data.stream[].chunk.usageanddata.usageare the same data — adding both doubles usage
Known blind spots (data-source limits, not bugs)
Session-title generation and web-search calls never record usage, so they cannot be priced. Active sessions are still appending, hence "today" is a lower bound (stated in the panel footer).
Privacy & permissions
Short version: this plugin is a pure observer — it only reads local logs, writes no files and runs no commands; its only outbound traffic is the account-balance lookup, which you can switch off.
| Permission | What this plugin actually does |
|---|---|
| Files (read) | Only $DSH_HOME/sessions/**/session[.v3].jsonl[.zstd] (DSH's own session-log directory) |
| Files (write) | None — no files, no cache on disk (aggregates live in memory and are recomputed on restart) |
| Network | Only the account-balance lookup; turn "show balance" off in Settings for a fully zero-egress setup |
| Command execution | None — nothing is spawned |
| Credentials | Resolved by reference name (default DEEPSEEK_API_KEY) from DSH's credential service; the secret stays in host-process memory and is never sent to the browser, logged, or written to disk |
Balance lookup:
- Calls
GET https://api.deepseek.com/user/balancefrom the host (Node) side only; the browser never sees the key - The panel shows
account balance ¥xin the top-left;offmeans you disabled it in Settings, andlookup failedmeans the credential is missing or the endpoint returned an error - Toggle it (and change the credential name) in Settings → Plugins → dsh-token-meter-panel
Local HTTP routes (used by the panel):
GET /token-meter-panel/summary,/token-meter-panel/balance,/token-meter-panel/health- Aggregate numbers only (token counts, money, call counts, session ids) — never conversation content, file paths, or credentials
- All three routes go through DSH's
connectionHost/Origin fence and browser authentication (requestRejection)
Configuration
Settings namespace: token-meter-panel
| Key | Default | Meaning |
|---|---|---|
dailyBudget |
50 | Daily budget in CNY; 0 = unlimited |
alertAtPercent |
80 | Warn at this share of the budget (bar changes color) |
showBalance |
true | Query and show the account balance (off = zero network access) |
apiKeyEnv |
DEEPSEEK_API_KEY |
Credential name used for the balance lookup |
refreshSeconds |
60 | Panel auto-refresh interval in seconds; 0 = off |
officialOnly |
true | Count only DeepSeek-billed calls (third-party providers excluded) |
offPeak / peak |
official rates | Per-model unit prices (CNY per million tokens) |
How it works
browser (panel)  ──fetch──▶  host routes              ──▶  collection core
 lib/client.js                lib/index.js                  src/core.mjs + src/zstd.mjs
 registers sidebar.panellist  GET /token-meter-panel/summary  reads ~/.dsh/sessions
 registers main keyed slot    GET /token-meter-panel/balance  multi-frame zstd decode
 useProjection(tokenUsage)    GET /token-meter-panel/health   day/session/model folds
The host half registers a token-meter-panel settings namespace; the browser half contributes two slots:
sidebar.panellist (icon, id: tokenmeter) and main (panel, key: tokenmeter) — the ids must
match so clicking the icon switches to the panel.
All three read-only routes reuse DSH's connection.requestRejection for the Host/Origin fence.
Development
npm run setup    # create local module-resolution links (see below)
npm test         # collection self-check + host smoke + client smoke
npm run build    # rebuild lib/client.js (required after editing src/client/index.js)
npm run watch    # watch mode; works with DSH's client-hmr for live replacement
Why
npm run setupexists: Node resolves junctions/symlinks to their real path, soimport '@deepseek-ai/schemastery'from inside the plugin directory never reaches the profile'snode_modules. The script links the base packages into the plugin directory. It is not needed at runtime: the host's Node service resolves from the application directory and finds the base packages normally. Without schemastery the plugin degrades gracefully — no settings namespace, everything else keeps working.
Host-side changes (lib/index.js, src/core.mjs) need a DSH restart; client-side changes are picked
up by DSH's client-hmr after rebuilding the bundle.
License
MIT, see LICENSE.
The Zstandard multi-frame scanning logic in src/zstd.mjs is adapted from DeepSeek Harness's
@deepseek-ai/dsh-session-persistence-jsonl (MIT, Copyright (c) 2026 DeepSeek). Its copyright
and permission notice is retained as required — see THIRD-PARTY-NOTICES.md.
Links
More in this category
bowenliang123/dsh-context★ 1472
DSH context insight panel: Context dashboard + /context command + Context browser — one-stop context lifecycle management with categorized composition, content details, evolution trends, compaction/injection events, and stats.
Han-1413141/dsh-cost-meter★ 321
Per-session and daily API cost, budget with usage %, official balance, history dashboard, and one-click official price sync with peak/off-peak pricing.
zh667/TokenLedger★ 202
Sidebar usage panel that attributes tokens to the relay site that served each request, read from your existing provider config: today/month/all-time totals, per-site and per-model breakdowns, a year activity heatmap, and New API / Sub2API / DeepSeek balances.
wssfk12138/dsh-damage-pulse★ 184
Tracks DeepSeek token usage, per-call and session costs, and account balance with cache-aware charge animations in the DSH Web UI.
Ychris12138/dsh-usage-stats★ 161
Multi-provider usage dashboard with provider/model token breakdowns, calendar drill-downs, account balances, and OpenCode Go / Z.ai subscription quota tracking.
PolinniZhong/dsh-personal-center★ 120
Personal center for DeepSeek Harness: cross-session usage statistics, per-model cost estimation, global custom instructions, a global font-size adjuster, a data-driven desktop pet with bitmap & vector skins, and a conversation status overview, all local and offline.
Community comments
Comments are public GitHub Discussions. Loading them connects to GitHub and Giscus; a GitHub account is required to post.