Records real clicks, inputs, navigation and network traffic in a user-guided browser session for DSH, then generates a Markdown timeline report (report.md + events.jsonl) to build API-level skills.
Install
# from npm (prebuilt)
dsh plugin --profile web add dsh-web-recorder
# from GitHub (first run asks for allowBuilds approval — follow the hint, retry)
dsh plugin --profile web add github:kakajun/dsh-web-recorder
Any plugin you install runs third-party code with your own permissions — it can read your files, use your credentials, and reach the network, and tool approvals don’t sandbox it. GitHub-sourced plugins also run build scripts at install time — pnpm blocks those until you allow them, so an install can stop with ERR_PNPM_GIT_DEP_PREPARE_NOT_ALLOWED or ERR_PNPM_IGNORED_BUILDS; dsh prints the exact key to add under allowBuilds in your profile’s pnpm-workspace.yaml, and the install works on the next run. Allowing a build is a trust decision: only install sources you trust, and pin a commit (github:owner/repo#sha).
README
Languages: English · 简体中文
A browser-operation recorder plugin for DSH. It targets the scenario where a human drives the browser while the plugin records in the background: it can attach to an already-open browser window (e.g. a Playwright MCP browser with a debugging port — this is optional), or launch its own headed browser window (the local Edge by default); as you interact with pages normally, the plugin records every click / input / form submission and every network request / response / failure, then generates a Markdown summary report when recording stops.
Why this plugin exists (design intent)
To have an agent talk to a business platform (e.g., an EIP-style system) directly through its APIs, you first need to answer three questions: which endpoints the platform exposes, which endpoint each business step maps to, and what the request / response shapes look like. The traditional approach is to read API docs or reverse-engineer the frontend code — but docs are often missing or outdated, and even with an endpoint list in hand, it is hard to line up “what the user does on the page” with “which API calls fire underneath”.
This plugin takes a different angle: no reverse engineering — just keep the operation evidence. As a developer, you first arm the recorder (recorder_start), then let the target business flow run completely inside a monitored headed browser window — driven either by a human manually, or step by step by a browser-automation tool such as playwright MCP / browser-use — and that is it: no more digging through docs afterwards, because the raw data left behind by this one session already answers all three questions:
- UI event timeline: when each click / input / form submission happened, which element it hit, and what value was entered;
- Network event timeline: which
xhr/fetchrequests each step triggered — method, URL, request headers, request body, response body, and failure reasons.
Both kinds of events are written to events.jsonl in real time, interleaved by the order they occur, so the two timelines are naturally aligned: for any business step you can find in the raw data “which API it called, how the parameters were filled in, and what came back”. Once recording stops, the generated report.md turns that operation timeline plus the request details into an easy-to-read digest.
Feed those raw records to an LLM for analysis: it can generalize the full picture of “business flow × API call sequence × data contract” and distill it into a skill — breaking the flow into steps, noting which endpoint to call per step, what the request / response look like, and how to handle errors — so the agent can later follow the skill to drive the same flow purely through APIs, without ever depending on a human demo again.
In one sentence: walking the flow through once on the page = leaving analyzable operation evidence = the raw material for an LLM to build an API-level skill. Recording is only the capture; analysis and distillation are left to the model.
Preview
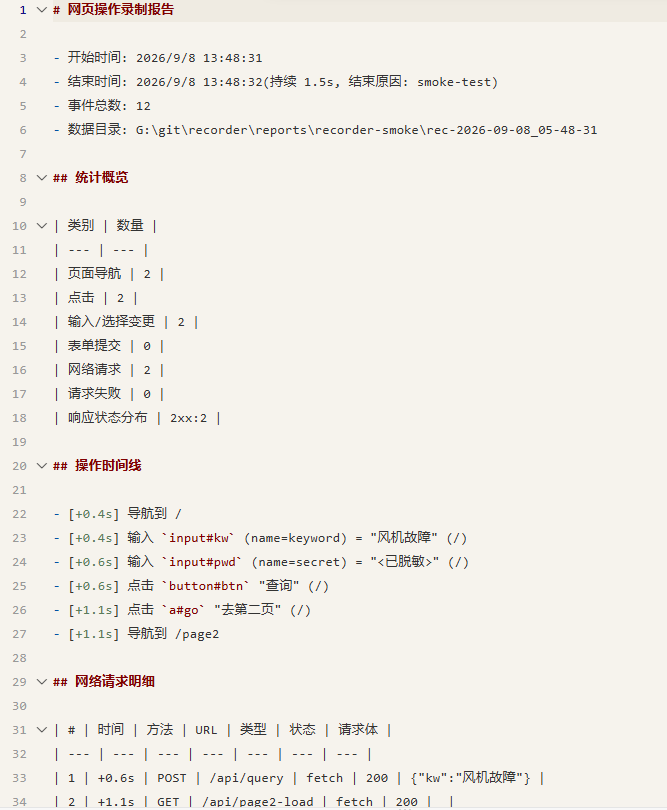
The screenshots below are artifacts from a real recording session (the tests/smoke.mjs smoke test running “enter keyword → query → go to page 2” against a local page).
① report.md summary — stats overview + operation timeline + network request details, presenting “business steps” and “API calls” side by side:
② events.jsonl raw event stream — one event per line (navigation / click / input / request / response …), written in real time in occurrence order; the most complete evidence for analysis:
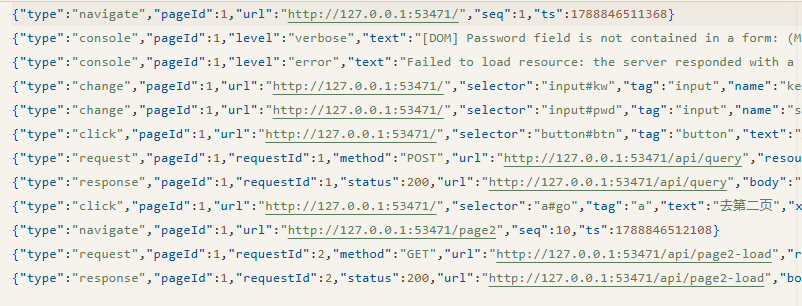
Reading the two side by side: a single “enter keyword and query” action shows up in events.jsonl as the matching POST /api/query request and 200 response events, and in report.md as one request-detail row — a direct illustration of the “walk the flow through once, keep the analyzable evidence” idea described above.
Registered tools
| Tool | Description |
|---|---|
recorder_start(url?, waitSeconds?) |
Starts recording: attaches to an existing browser window when possible (cdpUrl, or an auto-discovered Playwright MCP browser with a debugging port), otherwise launches a headed browser; optionally navigates to the starting URL; waitSeconds waits N seconds before anything is recorded (skips login / initialization noise). Events are written to events.jsonl in real time |
recorder_stop() |
Stops recording: generates the report.md summary; in attach mode it only disconnects CDP (only plugin-launched windows are closed); idempotent |
recorder_status() |
Reports status: whether recording is active, per-type event counts, output directory, and the result of the last wrap-up |
If the user closes the browser window directly, the session is finalized automatically (reason: browser-closed) and the recorded data is kept.
Usage: how this plugin gets invoked
When it is picked up (trigger scenarios)
Once the plugin is enabled, its three tools show up in the DSH session's tool list; “hitting” the plugin happens when the model chooses a tool, based on the tool names and descriptions. When the user's task is about “figuring out which APIs a web business flow calls under the hood, what the parameters / responses look like, and producing an API-level flow description or skill from that”, the model should proactively call recorder_*. Typical task phrasings:
- “Figure out the API calls and their order behind the ‘xxx’ flow on platform XX, and turn it into a skill so I can do it purely via APIs from now on”
- “What request does the ‘Query’ button on page XX send? How are the parameters passed?”
- “I'll walk through the flow on the page; you record it, then analyze it and produce an API-integration guide”
If the question can be answered without real page interaction (e.g., it is already answered in docs), the plugin usually won't be picked up.
How the tools become available (loading)
This repository is itself a DSH plugin: the entry is lib/index.js (source src/index.ts); package.json's dsh.bundle.patch points to the cordis.patch.yml at the repo root, which merges the plugin into the host profile (its id / name are both dsh-web-recorder); the official @deepseek-ai/* packages are provided by the host via peerDependencies. Once enabled, the tools enter the model's tool list and are selectable with no further declaration.
Division of responsibilities: this plugin only “records” — “opening pages / acting” is up to a driver
The plugin does not operate pages itself — it exposes only recorder_start / recorder_stop / recorder_status, and its job is to “watch and record”: it launches a monitored headed browser window and logs, as raw events, every UI operation and network request happening inside it. Actually “opening page XXXX and performing the steps” is done by a browser driver, which can be:
- A human (no extra tooling required): clicking / typing / navigating manually in the window the plugin popped up;
- playwright MCP (optional): the model uses it to open pages, click, fill forms, and execute the target flow step by step;
- Other browser-use style tools (optional): likewise acting as the “hands” that drive the browser through the flow.
playwright MCP is not a required dependency: the plugin works perfectly without it — a human walking through the flow in the popped-up window is enough, and it is the most common setup. MCP / browser-use only automate “opening pages + performing the steps”; they are optional extras.
The model (agent) orchestrates the session: arm the recorder first, direct the driver to run the flow, then wrap up and read the artifacts.
Recommended flow: open page X → record the steps (works with or without playwright MCP)
- (Optional, recommended when MCP is available) the driver opens the page first: let playwright MCP open the target page; as long as the MCP browser was started with
--remote-debugging-port(see “Collaboration prerequisite” below),recorder_startauto-discovers its CDP port and attaches to that already-open window — no new browser is launched, and the MCP can keep driving that same window. Without playwright MCP, skip this step and go straight to step 2: a human operates the window the plugin pops up - Arm the recorder:
recorder_start()— attaches to the existing window, or pops up the monitored browser and opens the start page; from this moment every operation and network request in the window is streamed toevents.jsonl(note: page loads happening after this point are recorded too — see “Initialization-request noise” below) - Driver runs the flow: let playwright MCP / browser-use (or a human) execute the whole target flow inside the same monitored window — opening pages, filling forms, clicking submit, going to the next page… both the UI events of each step and the API calls they trigger are captured
- (Optional) check progress:
recorder_status()— whether recording, per-type event counts, artifact directory - Wrap up:
recorder_stop()— generates thereport.mdsummary (in attach mode it only disconnects the CDP session and leaves the external browser running; plugin-launched windows are closed; closing the window manually also finalizes the session) - Analyze and distill: the model reads
report.md+events.jsonl, generalizes “flow steps × API calls × request/response contract”, and further distills it into a skill or an API-integration guide
Collaboration prerequisite (important)
- playwright MCP is optional, not a prerequisite: the plugin records fine without it (and without browser-use) — a human performing the flow in the popped-up window is enough, and that is the most common setup. MCP / browser-use only automate “opening pages + performing the steps”.
- The one case where you cannot keep working in the browser playwright MCP already opened: the MCP browser was started without
--remote-debugging-port. The recorder then cannot attach and falls back to takeover: it notes the MCP browser's current URL, kills the MCP browser process, and re-opens the same page in a plugin-launched window. After that the MCP has lost its browser and can no longer drive it (if the MCP later opens a fresh window, that window is outside the recording scope too). To let the MCP and the recorder coexist — so the MCP can keep operating the very window being recorded — give the MCP browser a debugging port (or pointcdpUrlat it explicitly). - Recording covers the browser window the plugin attached to / started (including its new tabs / iframes); operations by any driver (human or automation) are only captured when they happen inside this window.
- Sharing one browser window with playwright MCP: start the MCP browser with a remote debugging port and the recorder attaches automatically. Pass a config file to
@playwright/mcp(--config=path/to/playwright-mcp.config.json) containing:
With port{ "browser": { "launchOptions": { "args": ["--remote-debugging-port=0"] } } }0, Chrome picks a free port and writes it to theDevToolsActivePortfile under its user-data-dir;recorder_startreads that file and attaches automatically (on Windows the MCP browser is located via thems-playwright-mcpuser-data-dir in the process command line). Without a debugging port the recorder cannot attach and falls back to takeover mode: it reads the MCP browser's current page URL, closes it, and re-opens the same page in a plugin-launched window. - You can also set
cdpUrlexplicitly in the plugin Config (e.g.http://127.0.0.1:9222) to choose the attach target; it takes precedence over auto-discovery. In attach moderecorder_stoponly disconnects the CDP session and never closes the external browser process.
Prerequisites and caveats
- A browser must be installed locally: Edge by default (
channel: msedge);chromeor a customexecutablePathare configurable. The plugin never downloads a browser - playwright MCP is not mandatory: the driver can be a human (operating the window the plugin popped up) or an automation tool such as playwright MCP / browser-use; with neither installed, the plugin simply opens its own window for a human to use
- The headed window is visible during recording by design, and closes when done
events.jsonlcontains full request/response data (headers/bodies); treat it as sensitive and do not share it
Initialization-request noise: opening the page directly records extra requests (verified)
Recording starts the moment recorder_start runs, and any page load that happens after that point falls inside the recording scope. So when recorder_start(url) opens the page directly (or a driver navigates after recording has begun), the page's own initialization requests are captured in full — session/auth checks, dictionaries, menus, config, user info, analytics beacons, and so on.
Measured on a local page that fires two initialization requests on load (/api/init, /api/config) and the business request /api/query only on button click:
| Approach | Initialization requests recorded | Business requests recorded |
|---|---|---|
recorder_start(url) opens the page directly |
2 (/api/init + /api/config) |
also captured once clicked |
| Page loaded first, then attach and record | 0 | 1 (/api/query) |
The difference comes purely from whether the page load happened before or after recording started.
Impact: those initialization requests are usually irrelevant to the target business flow and dilute the signal — when answering “what request does the Query button send?”, you must first separate page-inherent requests from action-triggered ones.
How to reduce the noise:
- Prefer attach mode: have the driver (playwright MCP started with
--remote-debugging-port, or an explicitcdpUrl) open the target page and wait until it settles, then callrecorder_start()with no url — recording begins with the page already ready, so initialization requests are not included. - When login / redirects are required: pass
waitSecondsat start (see the next section) so the plugin waits N seconds before recording anything; if already recorded, trim the leading load section by time. - Filter afterwards: in
events.jsonl, requests that immediately follow anavigateevent and have no matching UI event (click / change / submit) are almost always initialization noise. - Take a baseline: call
recorder_status()right before the operation and noteeventCount; afterwards only look at events whoseseqis greater than that baseline. - Analyze against the operation timeline:
report.mdinterleaves UI events and requests by time — the requests that line up with a click / input are the real business-flow APIs.
Wait period: waitSeconds on recorder_start (skip login / initialization up front)
When the target site requires a login, or the landing page fires a burst of initialization requests, there is no need to trim afterwards — just tell the plugin to wait a bit before recording:
recorder_start({ url: "https://target/login", waitSeconds: 10 })
- One single meaning: after recording starts, wait 10 seconds before recording anything, which is exactly “drop the first 10 seconds from the result”. Clicks / inputs / navigations / requests during the wait are never written to disk; recording begins normally once the wait is over.
- Timing baseline: the moment
recorder_startis called. Browser launch and the start-page navigation are inside that window, so the whole “login → redirect to home → home initialization” sequence is skipped. - Whole groups are dropped: if a request is issued during the wait, its response / failure is dropped too, so you never end up with a half record (response without request).
- Observable:
recorder_status()reportswaitRemainingSec(how much longer until recording actually starts — while > 0, actions are not recorded) andskippedEvents(events dropped during the wait); therecorder_stop()result and thereport.mdheader also state “waited 10s before recording: N events dropped during the wait”. - Omitted or 0 = start recording immediately (default, same as the old behaviour).
What gets recorded
- UI events: clicks (selector + element text + coordinates), input / select changes (name + value; password fields record the action only, never the value), form submissions, and page navigations. Captured via
context.exposeBinding+addInitScriptphase listeners; covers new tabs and iframes. - Network events: by default only
xhr/fetchAPI calls are recorded (requestResourceTypesis configurable) — per request: method / URL / resourceType / request headers / request body; plus response status and response body (truncated), and error reasons for failed requests. Console messages can optionally be recorded. - Artifacts: each session writes
<outputDir>/rec-<timestamp>/events.jsonl(full data, appended line by line in real time) andreport.md(operation timeline + request detail table + failed-request summary).
Config fields
| Field | Default | Description |
|---|---|---|
channel |
msedge |
playwright-core browser channel (msedge / chrome); uses a browser already installed locally, never downloads Chromium |
executablePath |
'' |
Custom browser executable path; overrides channel when non-empty |
cdpUrl |
'' |
CDP endpoint (e.g. http://127.0.0.1:9222); when set, attach to that existing browser first. When empty, a Playwright MCP browser with a debugging port is auto-discovered and attached; otherwise falls back to takeover / launching a new window |
outputDir |
'' |
Root directory for artifacts; when empty, defaults to reports/recorder under the current working directory (the folder the user is working in, i.e. the harness session cwd) |
captureResponseBodies |
true |
Whether to capture xhr / fetch response bodies |
maxBodyBytes |
16384 |
Maximum number of bytes recorded for a single request / response body; anything beyond is truncated |
recordConsole |
false |
Whether to record console messages |
requestResourceTypes |
xhr,fetch |
Comma-separated resourceType whitelist; only matching requests are recorded (response / failure events are filtered along with the request). By default only API calls are recorded, not static assets or documents |
redactHeaders |
cookie,authorization,proxy-authorization,x-api-key,set-cookie |
Comma-separated request header names to redact (case-insensitive); matching header values are recorded as <redacted> |
Build & verify
pnpm install       # install dependencies (devDependencies aligned with peerDependencies)
pnpm typecheck     # tsc --noEmit
pnpm test          # vitest unit tests (pure functions for report generation)
pnpm build         # tsdown output to lib/ (required by plugin loading and the smoke test)
pnpm smoke         # real-Edge end-to-end smoke test (needs a browser installed locally; artifacts under reports/)
pnpm smoke:mcp     # MCP auto-discovery attach smoke test (simulates an MCP Chrome with a debugging port)
pnpm smoke:wait    # wait-period smoke test: nothing is recorded during waitSeconds, recording resumes after it
awesome-dsh-plugin compliance checklist
This repository is aligned with the awesome-dsh-plugin/contributing guide:
package.jsondeclaresdsh.bundle.patch: ./cordis.patch.yml(seecordis.patch.ymlat the repo root; itsidmatches the internally registered namedsh-web-recorder)- Official
@deepseek-ai/*packages live inpeerDependencies:dsh-toolsis pinned with an explicit prerelease branch (the harness ships rc releases; a wide range without a branch is silently excluded by node-semver), andcordis/schemasteryare peers provided by the host - By default artifacts go to
reports/recorderunder the current working directory (the folder the user is working in), overridable viaConfig.outputDir - Ships a real smoke test
tests/smoke.mjs— not a placeholder repository
If you are submitting an entry to awesome-dsh-plugin:
- Add the
dsh-plugintopic in GitHub repository Settings → Topics - The one-line description must match the actual capabilities without exaggeration (e.g., claiming “3 tools” means 3 tools really exist)
- Optional: publish to npm (make sure
repositorypoints back to this repo and removeprivate: true); optionally put ascreenshots.jsonat the repo root
Known limitations
- Records only the browser window the plugin attached to / started (including its new tabs / iframes); operations in any other browser instance are not captured. For automation-driven recording, the driver must share the same browser instance: when the MCP browser runs with
--remote-debugging-portthe recorder auto-attaches over CDP (see “Collaboration prerequisite”); an MCP browser without a debugging port can only be handled by the takeover fallback (the MCP browser is closed and a plugin window is opened instead, after which the MCP can no longer drive that window). - Neither playwright MCP nor browser-use is a required dependency (a human operator is enough), but in takeover mode the MCP browser is killed, so from then on only a human can continue in the plugin-launched window.
- In plugin-launched-window mode the start page inevitably loads after recording has begun, so a batch of initialization requests (auth / dictionaries / config / analytics …) is always recorded along with it — see “Initialization-request noise”; only attaching to an already-loaded page avoids it.
- Sensitive request headers are redacted by default; request / response bodies get no content-level redaction (they may contain business data such as tokens), so treat
events.jsonlas sensitive data and do not share it. - UI events in cross-origin iframes rely on init-script injection; pages with very strict CSP may block the injection (network events are unaffected).
- When a click fires an API request and the page navigates away immediately, the browser cancels the response-body capture; the response body may then be missing for that request (the event itself is still recorded, just without a body).
Links
More in this category
Tencent/BrowserSkill#dsh-plugin-browserskill★ 1962
BrowserSkill bridge for controlling visible Chrome and Edge Agent Windows from DeepSeek Harness, with native browser tools, accessibility and VOM observations, screenshots, owned multi-session control, and a live Web UI overlay.
Lum1104/dsh-browser#bridge-browser★ 639
Chrome sidebar extension that lets DSH operate your browser directly, no vision capabilities required.
liustack/modsearch★ 470
Web search bridge for text-only agents: ask the web or X, get structured JSON evidence (search, fetch, citations).
DDDMUC/dsh-free-search★ 166
Free, keyless web search for DSH: 7 engines (DuckDuckGo/Bing/SearXNG free + Exa/Perplexity/DeepSeek paid), auto-failover, settings-page UI with API key inputs and official links, web_fetch, and an engine test tool.
Tabbit-Browser/dsh-plugin★ 101
Gives DeepSeek Harness control of the Tabbit Browser: auto-loads the tabbit-browser skill on install, detects official Tabbit and Tabbit Browser releases (>= 1.9.0), checks the tabbit-cli persistent runtime, diagnoses the per-platform DSH sandbox mode needed to call the CLI, and downloads the region-matched official installer via a background job when no qualifying version is present.
Tabbit-Browser/dsh-tabbit★ 101
Gives DeepSeek Harness control of the Tabbit Browser: auto-loads the tabbit-browser skill on install, detects official Tabbit and Tabbit Browser releases (>= 1.9.0), checks the tabbit-cli persistent runtime, diagnoses the per-platform DSH sandbox mode needed to call the CLI, and downloads the region-matched official installer via a background job when no qualifying version is present.
Community comments
Comments are public GitHub Discussions. Loading them connects to GitHub and Giscus; a GitHub account is required to post.