DeepSeek-styled cross-session token usage, request count, and tiered cost analytics dashboard.
Install
# from npm (prebuilt)
dsh plugin --profile web add dsh-token-usage-stats
# from GitHub (first run asks for allowBuilds approval — follow the hint, retry)
dsh plugin --profile web add github:jkStars/dsh-token-usage-stats
Any plugin you install runs third-party code with your own permissions — it can read your files, use your credentials, and reach the network, and tool approvals don’t sandbox it. GitHub-sourced plugins also run build scripts at install time — pnpm blocks those until you allow them, so an install can stop with ERR_PNPM_GIT_DEP_PREPARE_NOT_ALLOWED or ERR_PNPM_IGNORED_BUILDS; dsh prints the exact key to add under allowBuilds in your profile’s pnpm-workspace.yaml, and the install works on the next run. Allowing a build is a trust decision: only install sources you trust, and pin a commit (github:owner/repo#sha).
README
DSH web plugin: cross-session token usage, request count, and optional cost analytics (ctx.tokenUsageStats), with a self-contained dashboard page at /token-usage-stats (JSON feed at /api/token-usage-stats) and a sidebar footer entry opening the dashboard in an in-page modal.
Screenshots
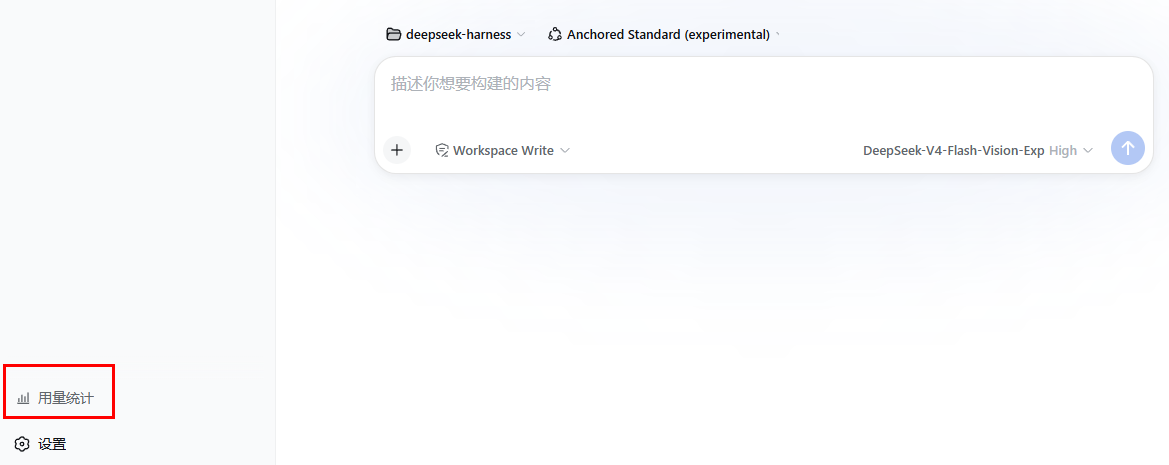
Sidebar footer entry — click 「用量统计」 to open the dashboard
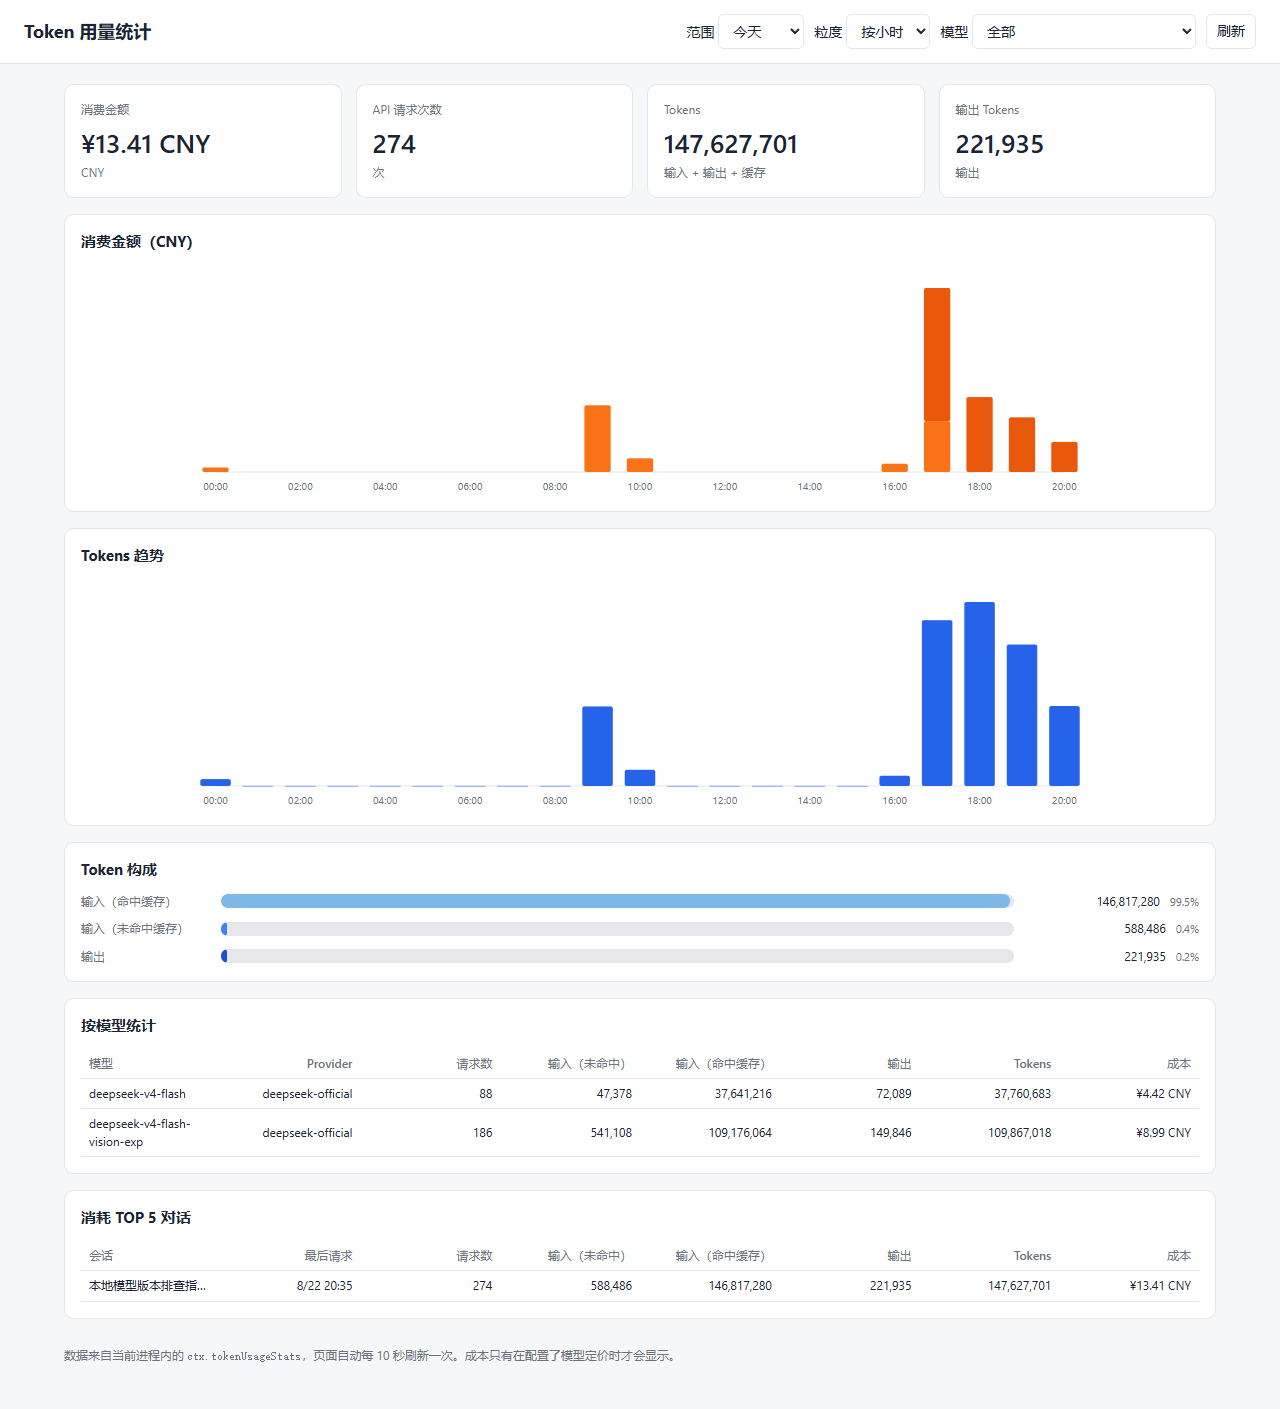
Dashboard — today view (cost stack, token trend, breakdown, per-model and top-session tables)
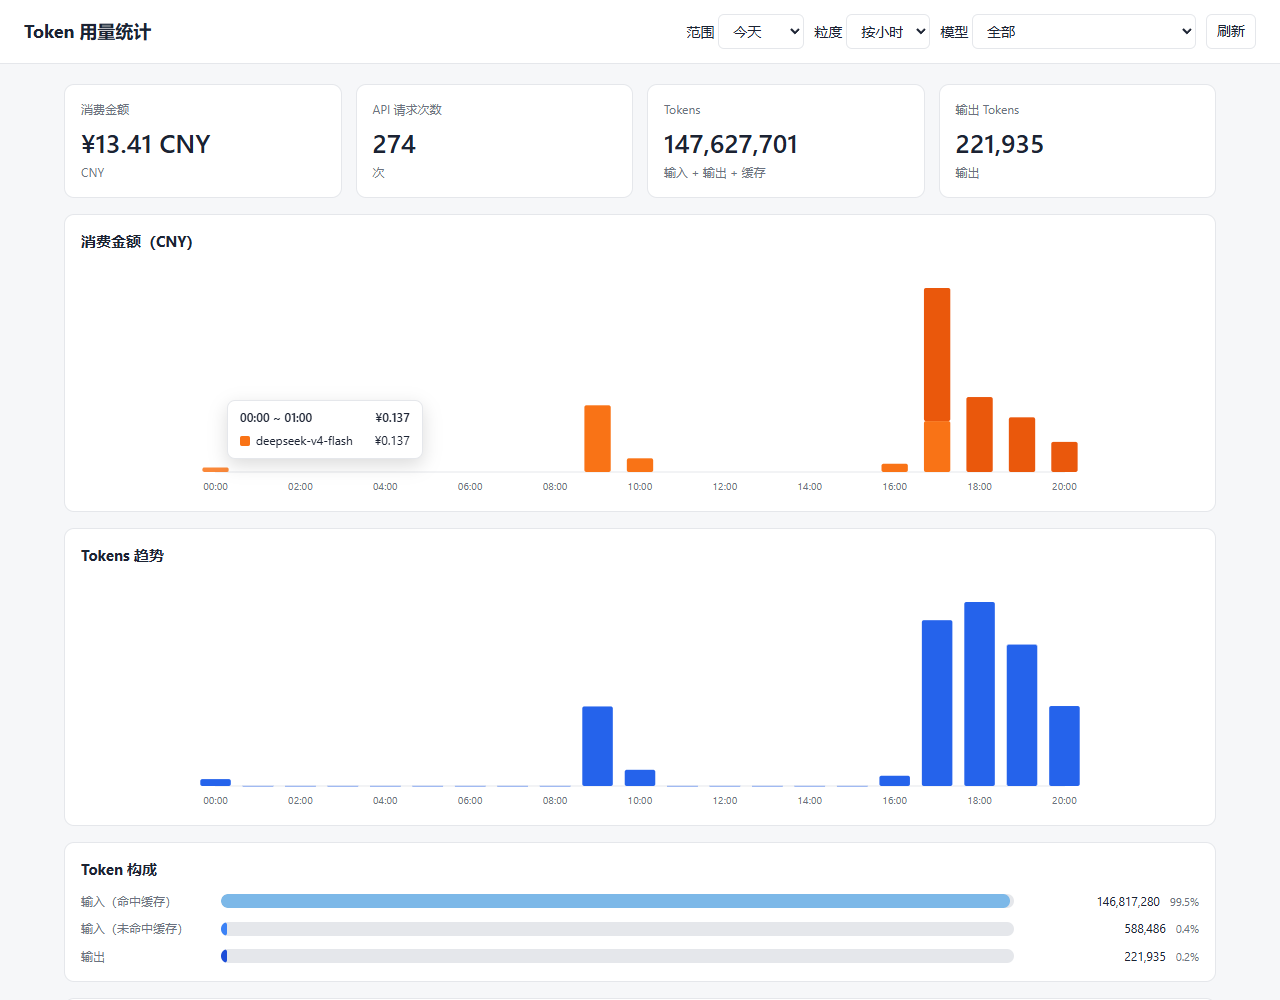
Breakdown tooltip (hover a bar for per-category details)
All-range daily view
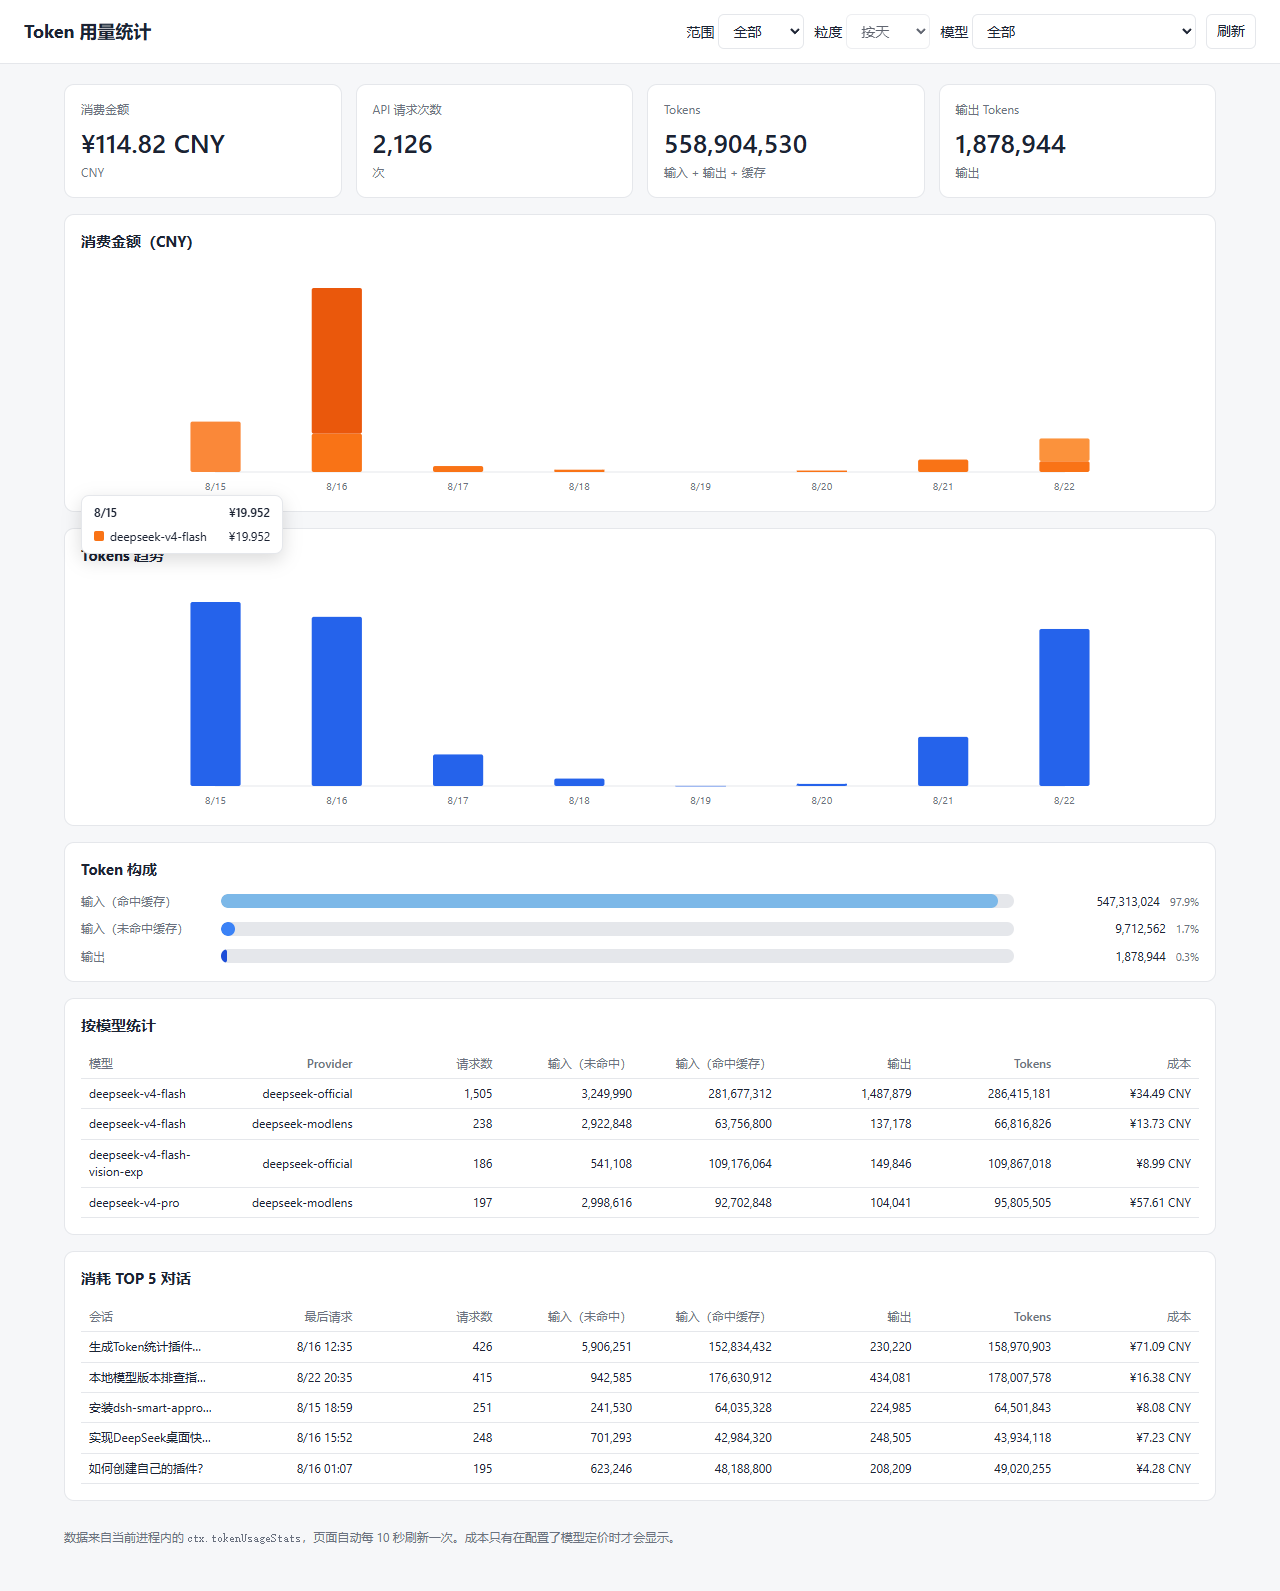
Note: Only DeepSeek official API costs are currently counted (token usage, request counts, and cost are replayed from local Harness session logs); it does not include API costs from other providers or channels.
Install
dsh plugin --profile web add dsh-token-usage-stats@0.3.15
The package's cordis.patch.yml inserts the plugin row; the browser half loads from the dsh.client manifest. Restart the host (or reload the GUI) after installing.
To update to a newer release:
dsh plugin --profile web add dsh-token-usage-stats@latest
Usage
Open the dashboard from the sidebar footer entry, or browse directly to http://<host>:<port>/token-usage-stats. The page defaults to today's hourly view and offers today / 3-day / 7-day / 30-day / all ranges, where the 7-day, 30-day, and all ranges show the daily view (the all-range view automatically downsamples to weekly or monthly intervals over longer spans to keep the charts readable and uncluttered). It auto-refreshes every 10 seconds. Cost figures appear only when model pricing is configured.
Config
The inserted row accepts config.currency (report cost in this currency) and config.pricing (per-model per-million-token prices). Cost is computed with a peak/off-peak split: peak hours are Beijing time 09:00-12:00 and 14:00-18:00, every other Beijing hour is off-peak; weekends (Beijing Saturday/Sunday) are always off-peak. A model priced with a peak/offpeak pair uses the matching tier by the usage record's time; a model priced with only the four flat keys uses that price at any hour. The default row ships currency: CNY and peak/off-peak pricing for deepseek-flash and deepseek-v4-pro (with historical model alias fallback).
Example override in the profile's own cordis.patch.yml:
- patch:
    - id: token-usage-stats
      config:
        currency: USD
        pricing:
          deepseek-flash:
            peak:
              uncachedInputPerMillion: 2.0
              cacheReadPerMillion: 0.04
              cacheWritePerMillion: 0
              outputPerMillion: 8.0
            offpeak:
              uncachedInputPerMillion: 1.0
              cacheReadPerMillion: 0.02
              cacheWritePerMillion: 0
              outputPerMillion: 4.0
Development
pnpm install   # devDependencies install the dsh 0.2.0-rc.2 @deepseek-ai/dsh-* types from npm
pnpm run build # tsc -> lib/types, tsdown -> lib/index.js + lib/client.js
The devDependencies are pinned to the same 0.2.0-rc.2 releases as the target runtime, so type checking runs against the exact API the host loads. peerDependencies declares ^0.2.0-rc.2, which the dsh host evaluates on install and boot (evaluatePluginCompatibility); an unsatisfied range refuses the installation or skips the bundle. Those peers are provided by the dsh host at runtime, not installed from npm.
Publish
npm run build
npm publish    # runs prepublishOnly (npm run build) automatically
Repository
- npm: https://www.npmjs.com/package/dsh-token-usage-stats
- Source: https://github.com/jkStars/dsh-token-usage-stats
Issues and pull requests are welcome.
Links
More in this category
bowenliang123/dsh-context★ 2300
DSH context insight panel: Context dashboard + /context command + Context browser — one-stop context lifecycle management with categorized composition, content details, evolution trends, compaction/injection events, and stats.
Han-1413141/dsh-cost-meter★ 459
Per-session and daily API cost, budget with usage %, official balance, history dashboard, and one-click official price sync with peak/off-peak pricing.
wssfk12138/dsh-damage-pulse★ 271
Tracks DeepSeek token usage, per-call and session costs, and account balance with cache-aware charge animations in the DSH Web UI.
zh667/TokenLedger★ 201
Sidebar usage panel that attributes tokens to the relay site that served each request, read from your existing provider config: today/month/all-time totals, per-site and per-model breakdowns, a year activity heatmap, and New API / Sub2API / DeepSeek balances.
Ychris12138/dsh-usage-stats★ 177
Multi-provider usage dashboard with provider/model token breakdowns, calendar drill-downs, account balances, and OpenCode Go / Z.ai subscription quota tracking.
PolinniZhong/dsh-personal-center★ 118
Personal center for DeepSeek Harness: cross-session usage statistics, per-model cost estimation, global custom instructions, a global font-size adjuster, a data-driven desktop pet with bitmap & vector skins, and a conversation status overview, all local and offline.
Community comments
Comments are public GitHub Discussions. Loading them connects to GitHub and Giscus; a GitHub account is required to post.