Per-model capability profiling for DSH: turns local session history into per-model dashboards of session counts, tool usage, error rates, and top error signatures, with time-range filters and multi-model comparison.
Install
# from GitHub (first run asks for allowBuilds approval — follow the hint, retry)
dsh plugin --profile web add github:Ansonfishing/dsh-cap-profile
Any plugin you install runs third-party code with your own permissions — it can read your files, use your credentials, and reach the network, and tool approvals don’t sandbox it. GitHub-sourced plugins also run build scripts at install time — pnpm blocks those until you allow them, so an install can stop with ERR_PNPM_GIT_DEP_PREPARE_NOT_ALLOWED or ERR_PNPM_IGNORED_BUILDS; dsh prints the exact key to add under allowBuilds in your profile’s pnpm-workspace.yaml, and the install works on the next run. Allowing a build is a trust decision: only install sources you trust, and pin a commit (github:owner/repo#sha).
README
Per-model capability profiling — a plugin for DSH (DeepSeek Harness).
Why
The more sessions you run, the harder it is to answer "which model is reliable at what, and where does it tend to fail". Reading raw session logs is slow, and manual tallying misses things.
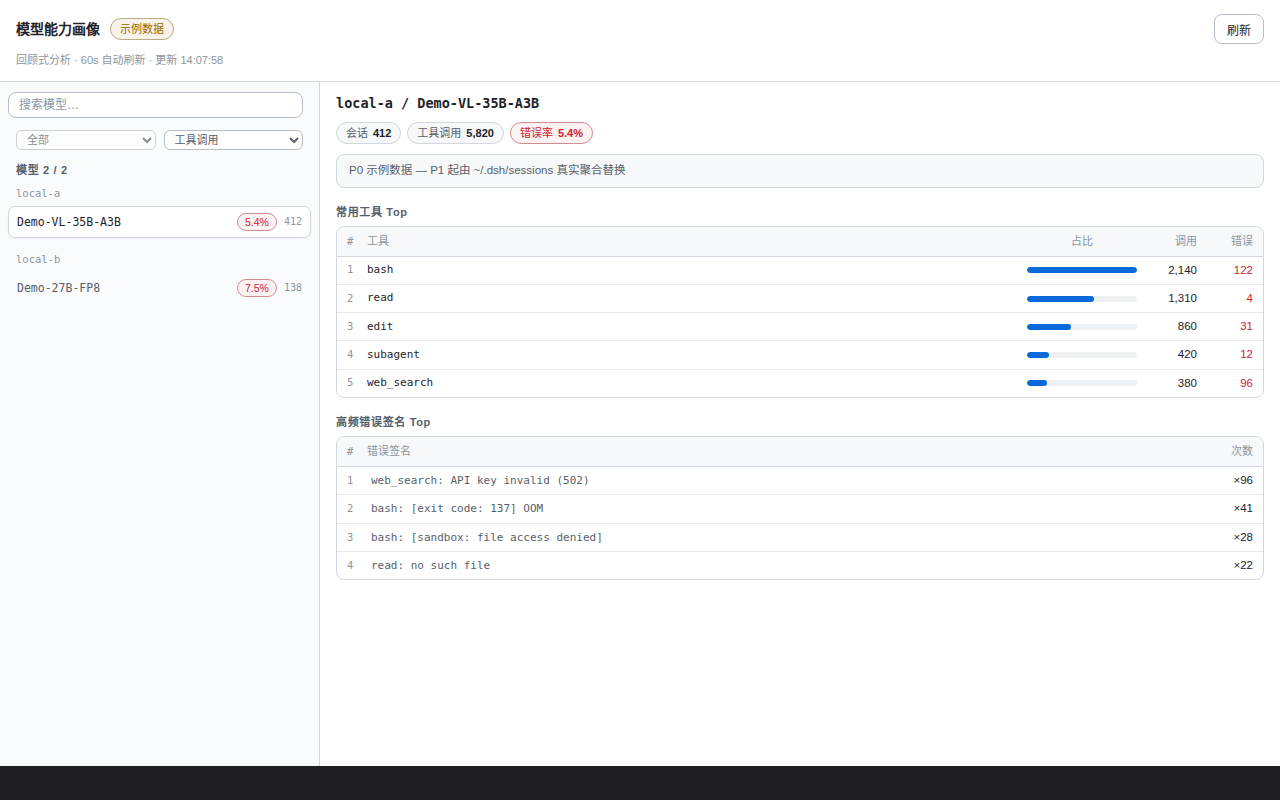
This plugin turns the session history in ~/.dsh/sessions into per-model capability profiles, directly answering: per-model session count, tool-call volume, error count, error rate, most-used tools, and top error signatures.
Quick start
Prerequisites: DSH (with web) + pnpm; Node ≥ 24 (zstd decoding uses the built-in zstdDecompressSync).
cd ~/.dsh/profiles/web                      # your DSH web profile directory
pnpm add github:Ansonfishing/dsh-cap-profile
Then add "dsh-cap-profile" to the dsh.profile.bundles array in package.json and restart dsh. A "Capability Profile" tab appears in the conversation view; the first open triggers a background initial scan (~20s for large histories), during which mock data is shown.
Features
- Model comparison table — per model (provider / model): sessions, tool calls, errors, error rate.
- Top-5 tools / Top-5 error signatures — per-model most-used tools (with a per-tool error-rate column: 0 gray / <5% amber / ≥5% red); normalized high-frequency error patterns (e.g.
bash: [exit code: 137] OOM) reveal where a model tends to fail. - Multi-model compare (≤4) — tick several models to open a compare view: one card per model with side-by-side metrics (best/worst/top tones), a Top-10 tools matrix, Top-5 error signatures, and a mini daily calls/errors bar chart (today's errors marked red); fewer than 2 valid selections falls back to the single-model detail.
- Time-range filter — All / Last 7 / Last 30 / Last 90 days / Today / Yesterday (anchored to the max date in the data, resilient to system clock drift).
- Read-only — analysis and display only, never mutates session data; the route validates a client header plus Origin/Referer and returns 403 on cross-origin requests.
- Incremental caching — per-file mtime baseline with background scanning (60s incremental / 24h full re-scan); while the initial scan is still running the route falls back to the last cache or mock data, so it never blocks.
- Zero runtime dependencies — pure Node.js.
No DSH? Take a look anyway
Clone this repo and open test/harness/index.html in a browser — a zero-dependency render harness (mock data; ?scenario=mock|live|empty|error switches scenarios, ?chrome=0 hides the harness bar).
Development
npm test # node --test test/*.test.mjs
Local development: after cloning, use pnpm add link:../path/to/dsh-cap-profile in your profile. Client-only changes need a browser refresh; Node-side changes (index.js / lib/*.js) need a dsh restart.
License
MIT © Ansonfishing
Links
More in this category
bowenliang123/dsh-context★ 2049
DSH context insight panel: Context dashboard + /context command + Context browser — one-stop context lifecycle management with categorized composition, content details, evolution trends, compaction/injection events, and stats.
Han-1413141/dsh-cost-meter★ 400
Per-session and daily API cost, budget with usage %, official balance, history dashboard, and one-click official price sync with peak/off-peak pricing.
wssfk12138/dsh-damage-pulse★ 260
Tracks DeepSeek token usage, per-call and session costs, and account balance with cache-aware charge animations in the DSH Web UI.
zh667/TokenLedger★ 202
Sidebar usage panel that attributes tokens to the relay site that served each request, read from your existing provider config: today/month/all-time totals, per-site and per-model breakdowns, a year activity heatmap, and New API / Sub2API / DeepSeek balances.
Ychris12138/dsh-usage-stats★ 172
Multi-provider usage dashboard with provider/model token breakdowns, calendar drill-downs, account balances, and OpenCode Go / Z.ai subscription quota tracking.
PolinniZhong/dsh-personal-center★ 118
Personal center for DeepSeek Harness: cross-session usage statistics, per-model cost estimation, global custom instructions, a global font-size adjuster, a data-driven desktop pet with bitmap & vector skins, and a conversation status overview, all local and offline.
Community comments
Comments are public GitHub Discussions. Loading them connects to GitHub and Giscus; a GitHub account is required to post.