Tracks DeepSeek Harness LLM token usage and cost (CNY, peak/off-peak pricing) with a settings dashboard, agent tools, HTTP API and persistent storage.
Install
# from npm (prebuilt)
dsh plugin --profile web add @angelyeye/dsh-cost-tracker
# from GitHub (first run asks for allowBuilds approval — follow the hint, retry)
dsh plugin --profile web add github:Angelyeye/dsh-cost-tracker
Any plugin you install runs third-party code with your own permissions — it can read your files, use your credentials, and reach the network, and tool approvals don’t sandbox it. GitHub-sourced plugins also run build scripts at install time — pnpm blocks those until you allow them, so an install can stop with ERR_PNPM_GIT_DEP_PREPARE_NOT_ALLOWED or ERR_PNPM_IGNORED_BUILDS; dsh prints the exact key to add under allowBuilds in your profile’s pnpm-workspace.yaml, and the install works on the next run. Allowing a build is a trust decision: only install sources you trust, and pin a commit (github:owner/repo#sha).
README
DSH Cost Tracker
LLM COST & USAGE TRACKING PLUGIN FOR DEEPSEEK HARNESS
简体中文 | English
An LLM cost-tracking plugin for DeepSeek Harness: automatically records token usage and cost (CNY) for every API call, with native support for DeepSeek's official peak/off-peak pricing (half-price off-peak) and Kimi Coding Plan subscription usage & equivalent-cost statistics. Visual settings dashboard with hover tooltips, in-chat agent queries, balance & quota monitoring — all persisted locally, survives restarts, and uninstalls cleanly.
一个为 DeepSeek Harness 打造的 LLM 花费统计插件:自动记录每一次 API 调用的 Token 用量与费用,原生支持 DeepSeek 官方峰值价格计费与 Kimi Coding Plan 订阅套餐的用量及等效费用统计。设置页可视化仪表盘、对话内 Agent 查询、账户余额与订阅配额监控,数据全部本地持久化。
Features
| Feature | Description | |
|---|---|---|
| 💰 | Cost tracking | Every API call is recorded automatically: input / output / cache-hit / cache-write tokens and cost (cache write billed at the cache-hit price), aggregated by day and by model |
| ⏰ | Peak/off-peak pricing | Built-in price table; peak windows (Mon–Fri 9:00–12:00, 14:00–18:00 Beijing time, excluding Chinese statutory holidays) vs half-price off-peak handled automatically; weekends and statutory holidays are fully off-peak (33 holiday days for 2026, overridable/disableable in the config card; make-up workday weekends stay off-peak); local models (e.g. ollama) count as 0; the table is versioned by pricing era (legacy / v41) and switches automatically to V4.1 Flash rates at 2026-09-10 12:00 Beijing time (peak 2.0 / 0.04 / 8.0), routing the legacy V4-Flash family to V4.1 Flash billing per the official footnote; deepseek-v4-pro keeps its own rates 9.0 / 27.0 / 0.30 and is never routed (the official retirement plan was revoked on 2026-09-14) |
| 🔔 | Peak-price notice | A "Peak/off-peak pricing & notice" panel in Settings: current tier + countdown strip, style switch (compact single-row · 24h-proportional / ring dial · phase dot), an optional two-row compact stacked layout for the compact style (bar-above-text / text-above-bar), a "Show time" toggle, popup alert + browser notification before a tier switch, lead time, popup position (bottom-right/center), alert type; a persistent strip in the sidebar footer (adapts to rail/collapsed). Mirrors dsh-cost-meter |
| 📌 | Six overview cards | Six cards at the top of Settings: Today / This month / Total spend / API requests / Tokens / Account balance. The three spend cards exclude subscription equivalent cost (shown as an annotation instead) |
| 👁️ | Vision model | Supports deepseek-v4-flash-vision-exp: priced as flash in the legacy era, billed at V4.1 Flash rates from 2026-09-10 12:00 (that legacy id is retired; requests are served by V4.1 Flash); images are converted to tokens per the official rule (≤384 tokens each, billed per API usage) |
| 🏷️ | Official model-name alignment | Billing recognises the official current name deepseek-flash (price-card note (1): "use the model name deepseek-flash"); older spellings such as deepseek-v4.1-flash normalize to the same rate, so an official rename can never silently drop usage into the fallback estimate |
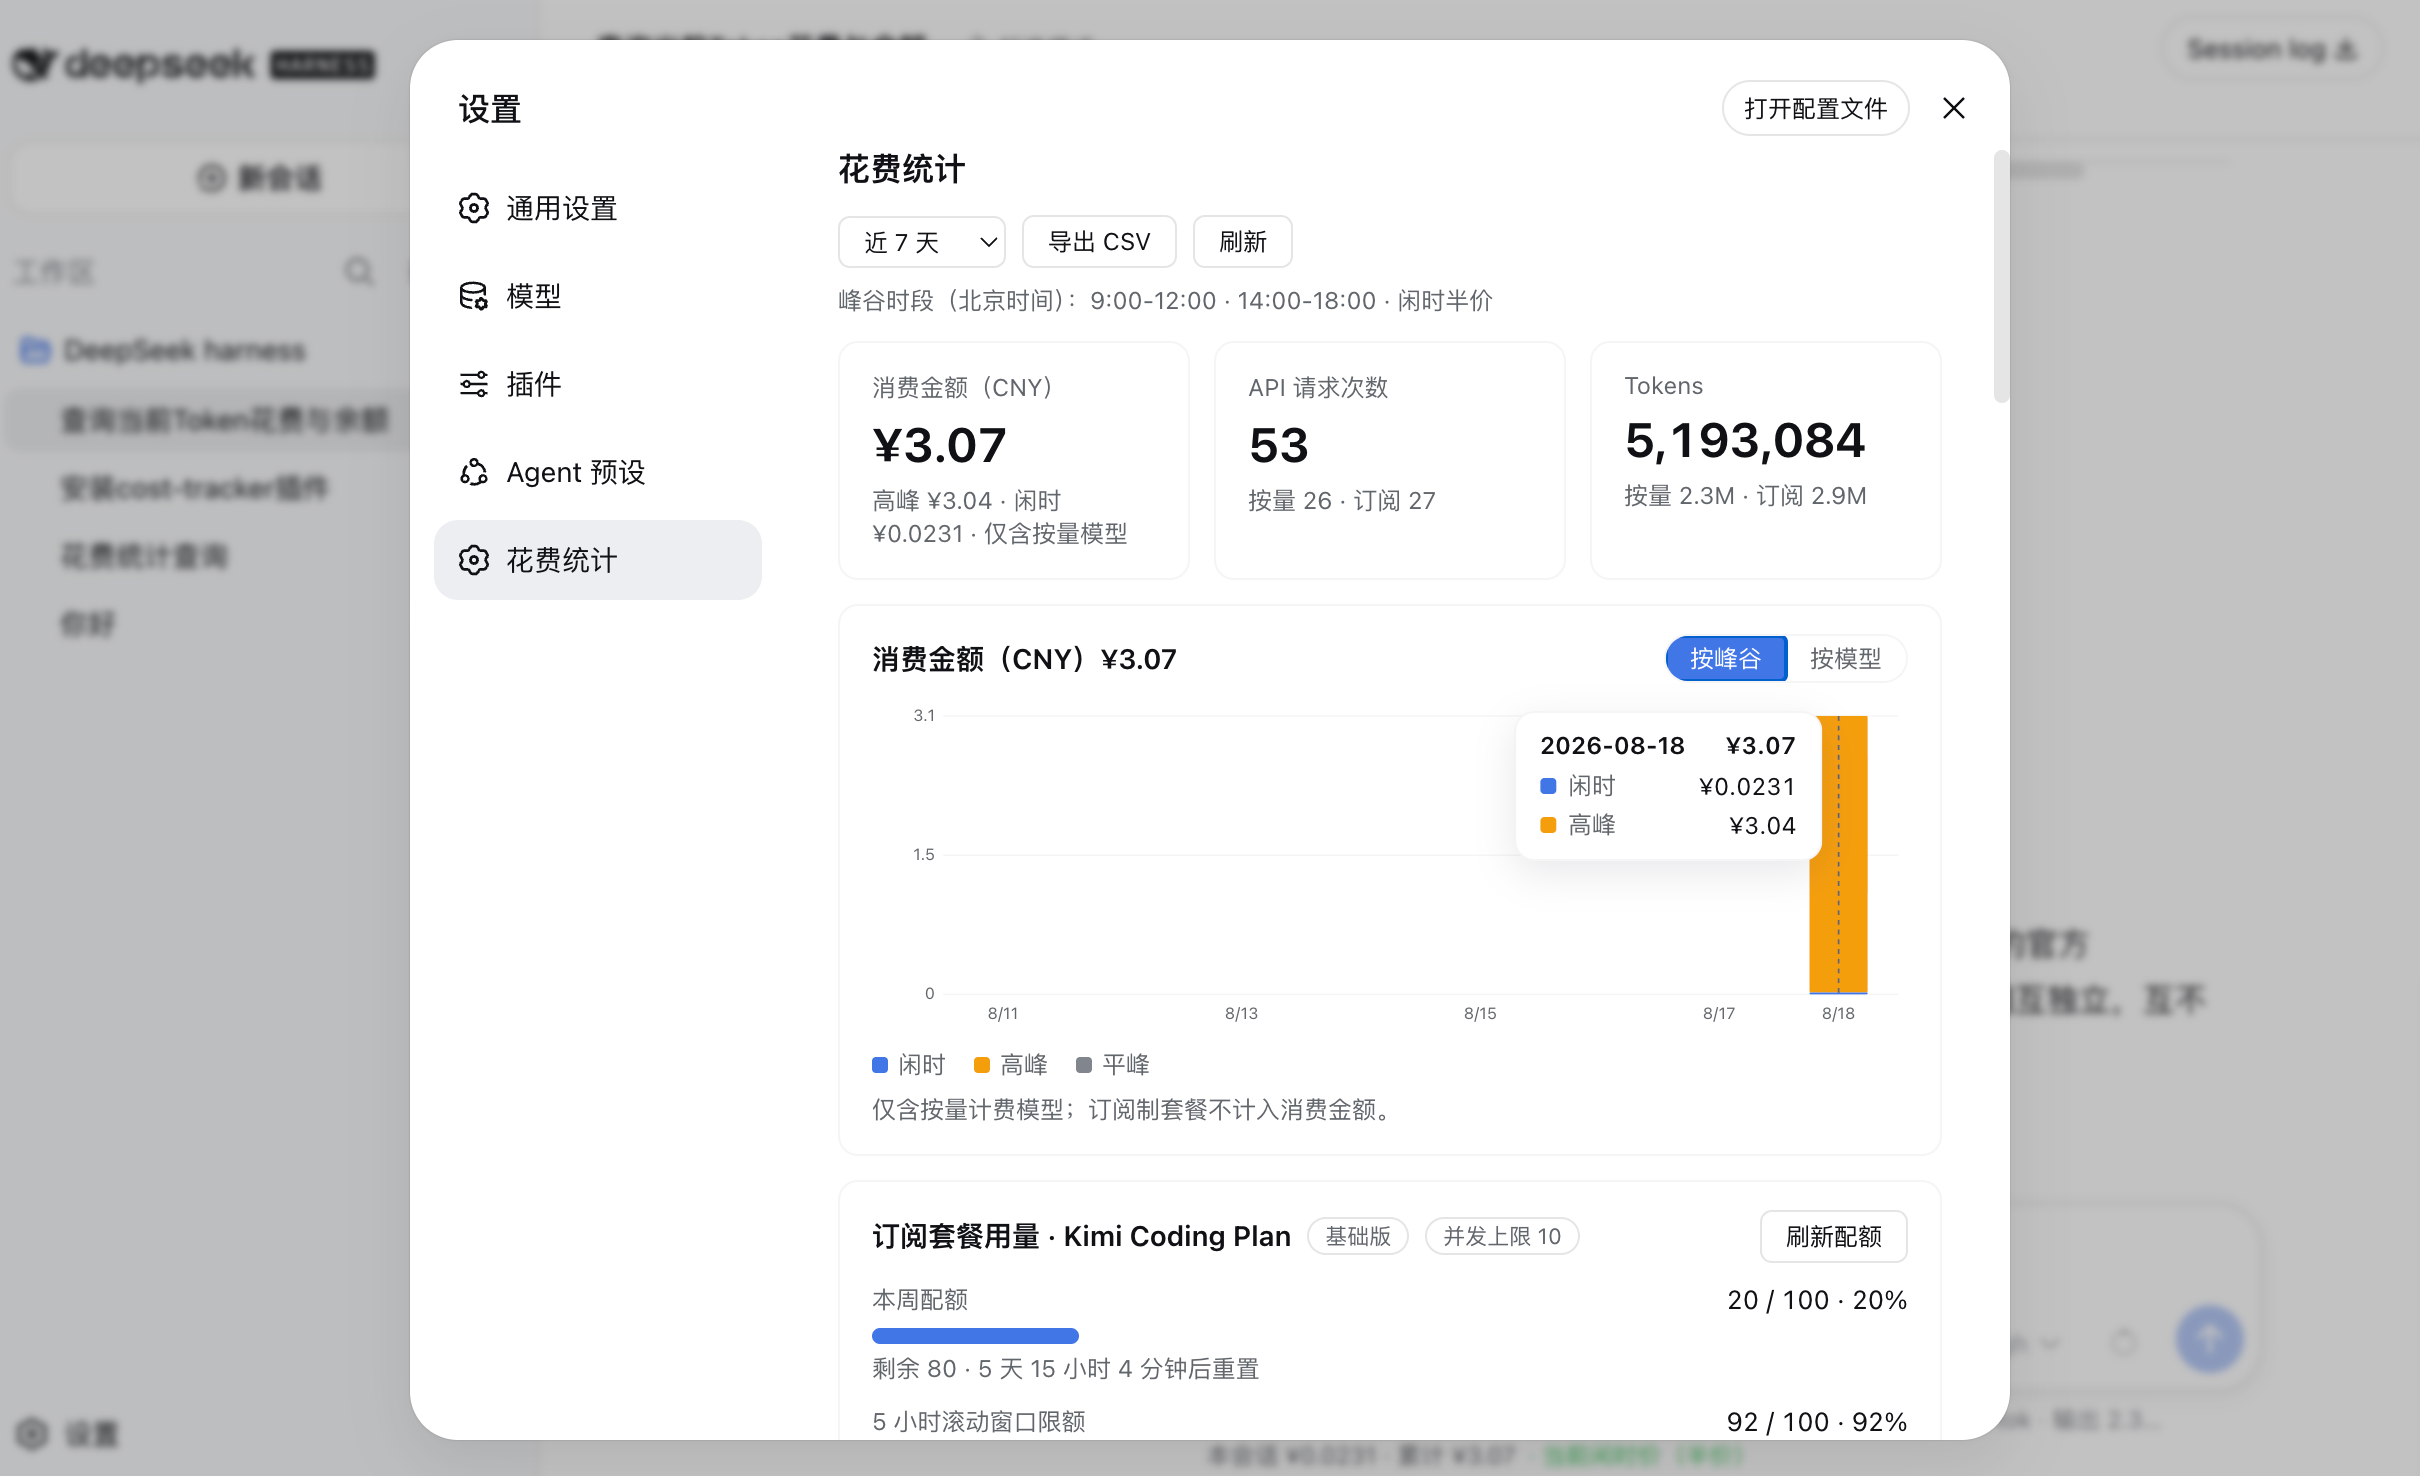
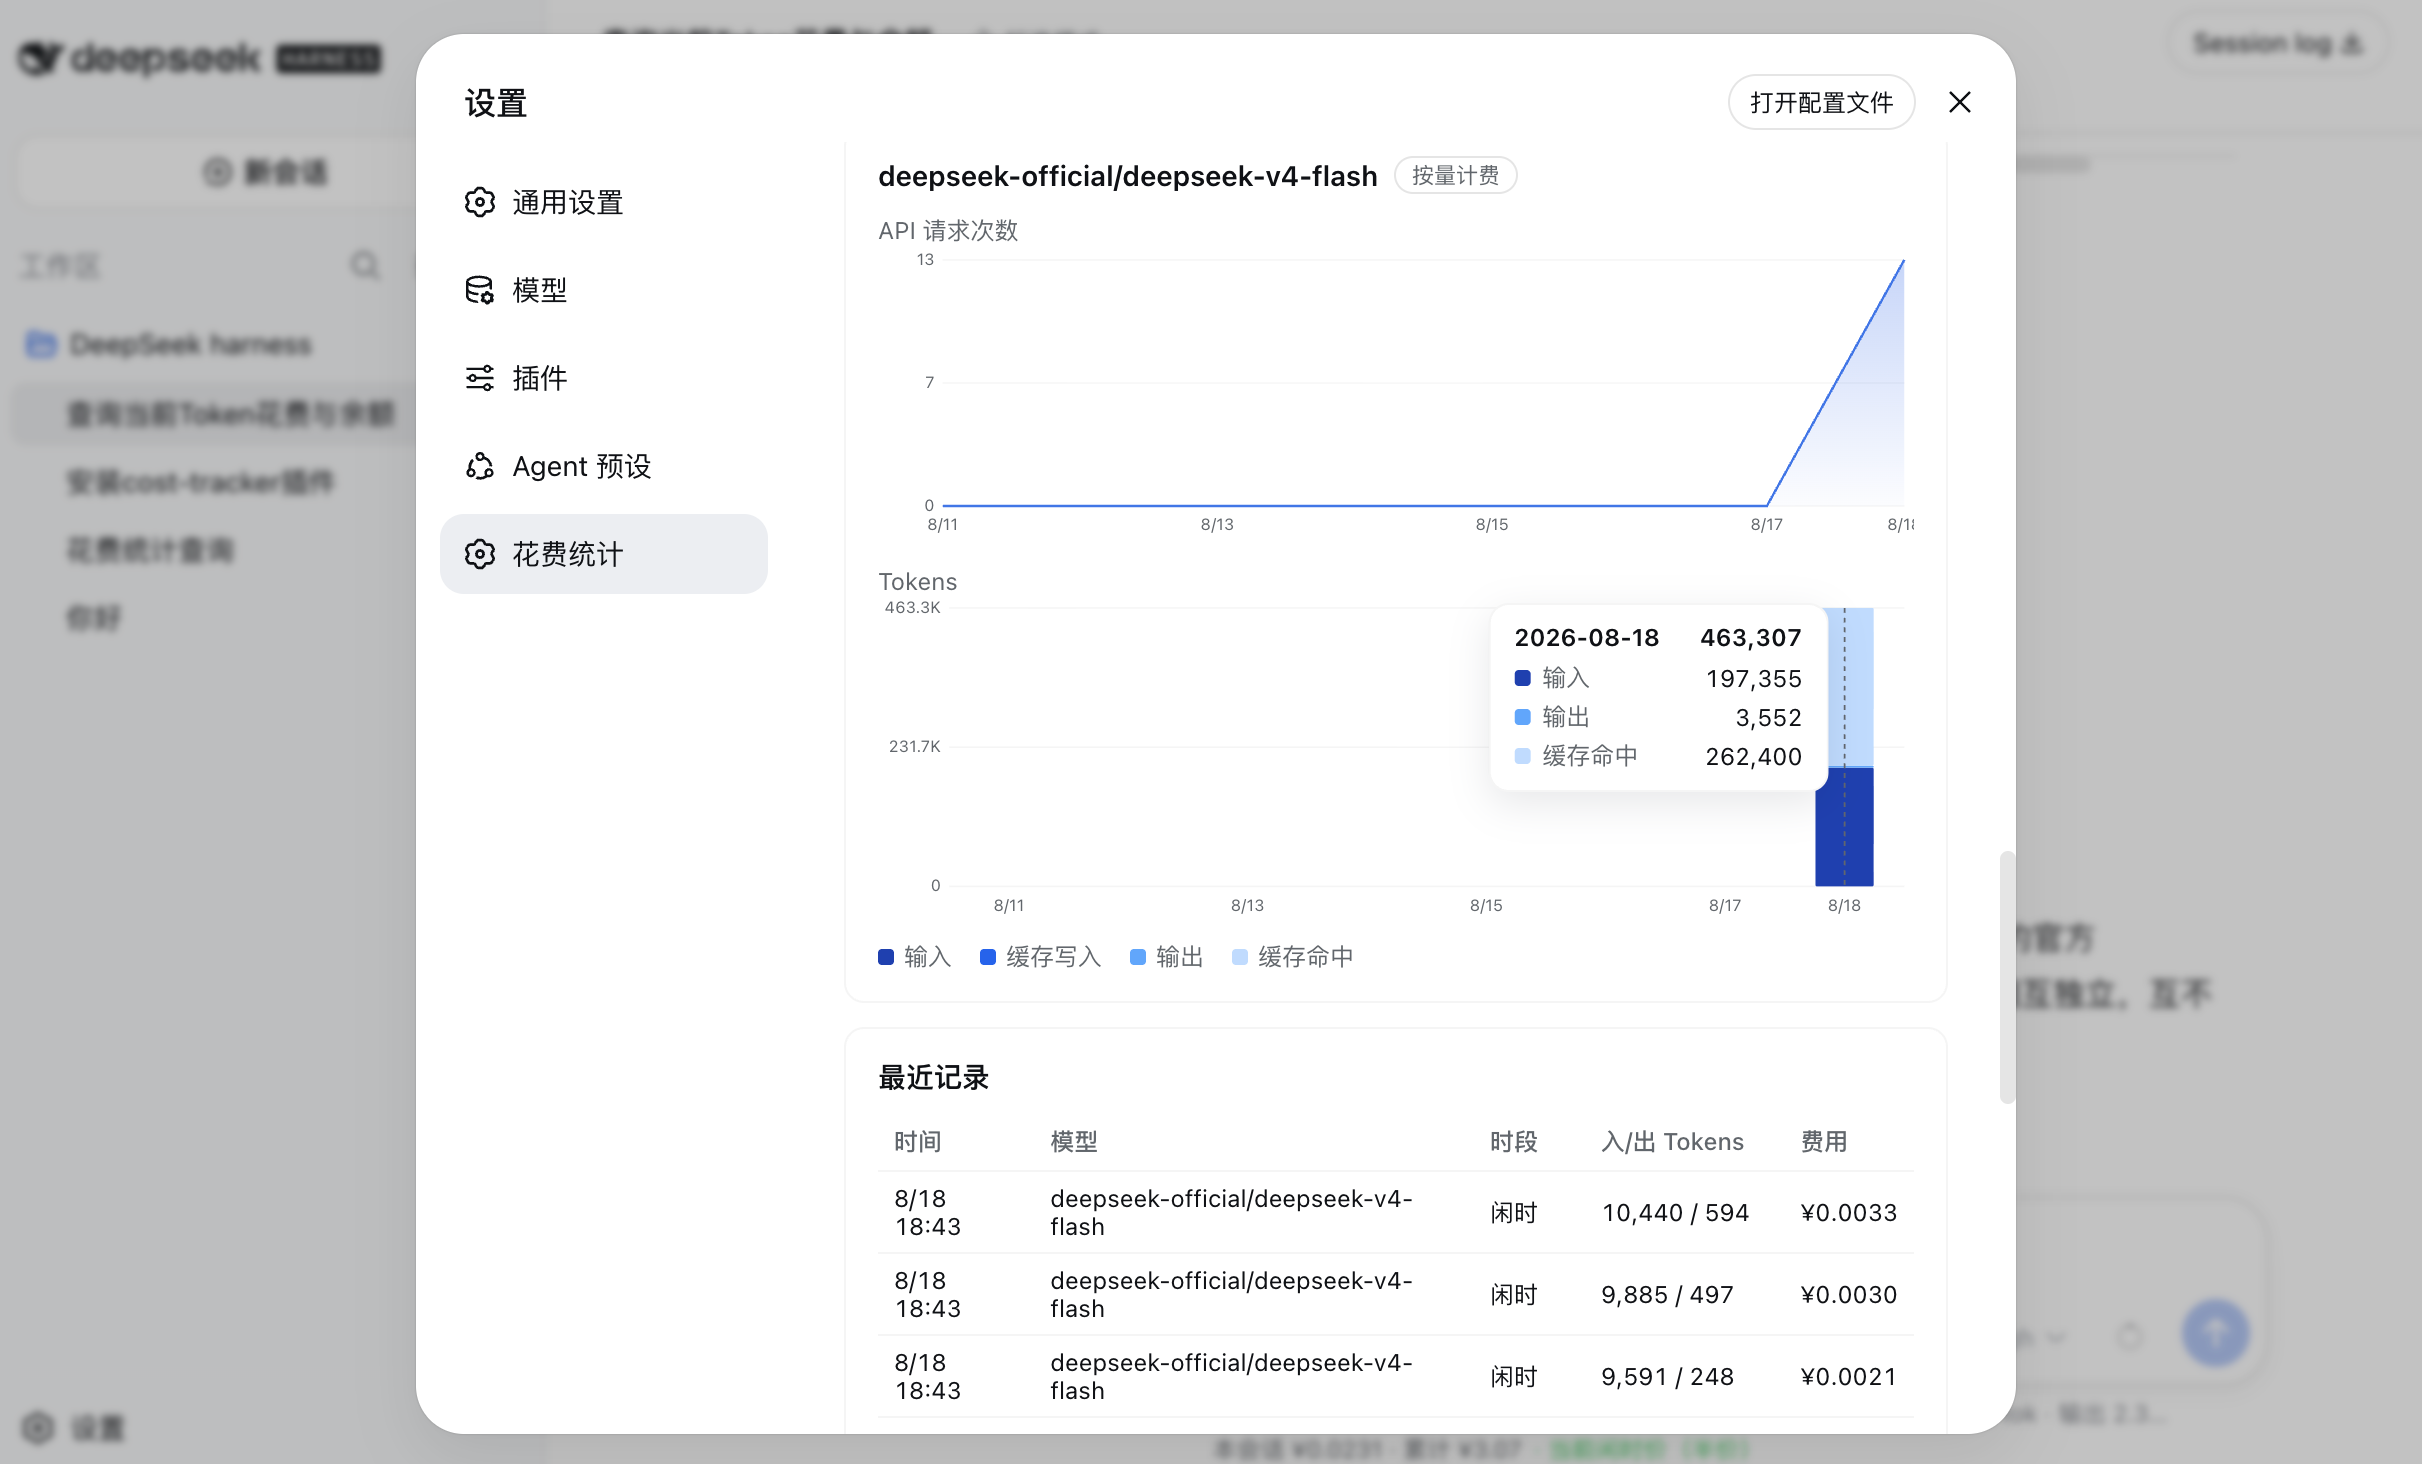
| 📊 | Visual dashboard | A new "Cost Statistics" page in Settings: overview cards, cost bar charts (by peak period / by model), per-model request & token charts — all with hover tooltips |
| 🧭 | Multi-machine aggregation (cloud sync) | Point it at your own self-hosted cloud service (separate dsh-cost-cloud repo, zero runtime dependencies) to merge usage from several computers; the dashboard then offers a This machine / This machine + cloud / Cloud only switcher plus a device × Agent matrix (row totals = column totals = grand total). Only token counts, cost, timestamps and identifiers are uploaded, with optional session-id masking |
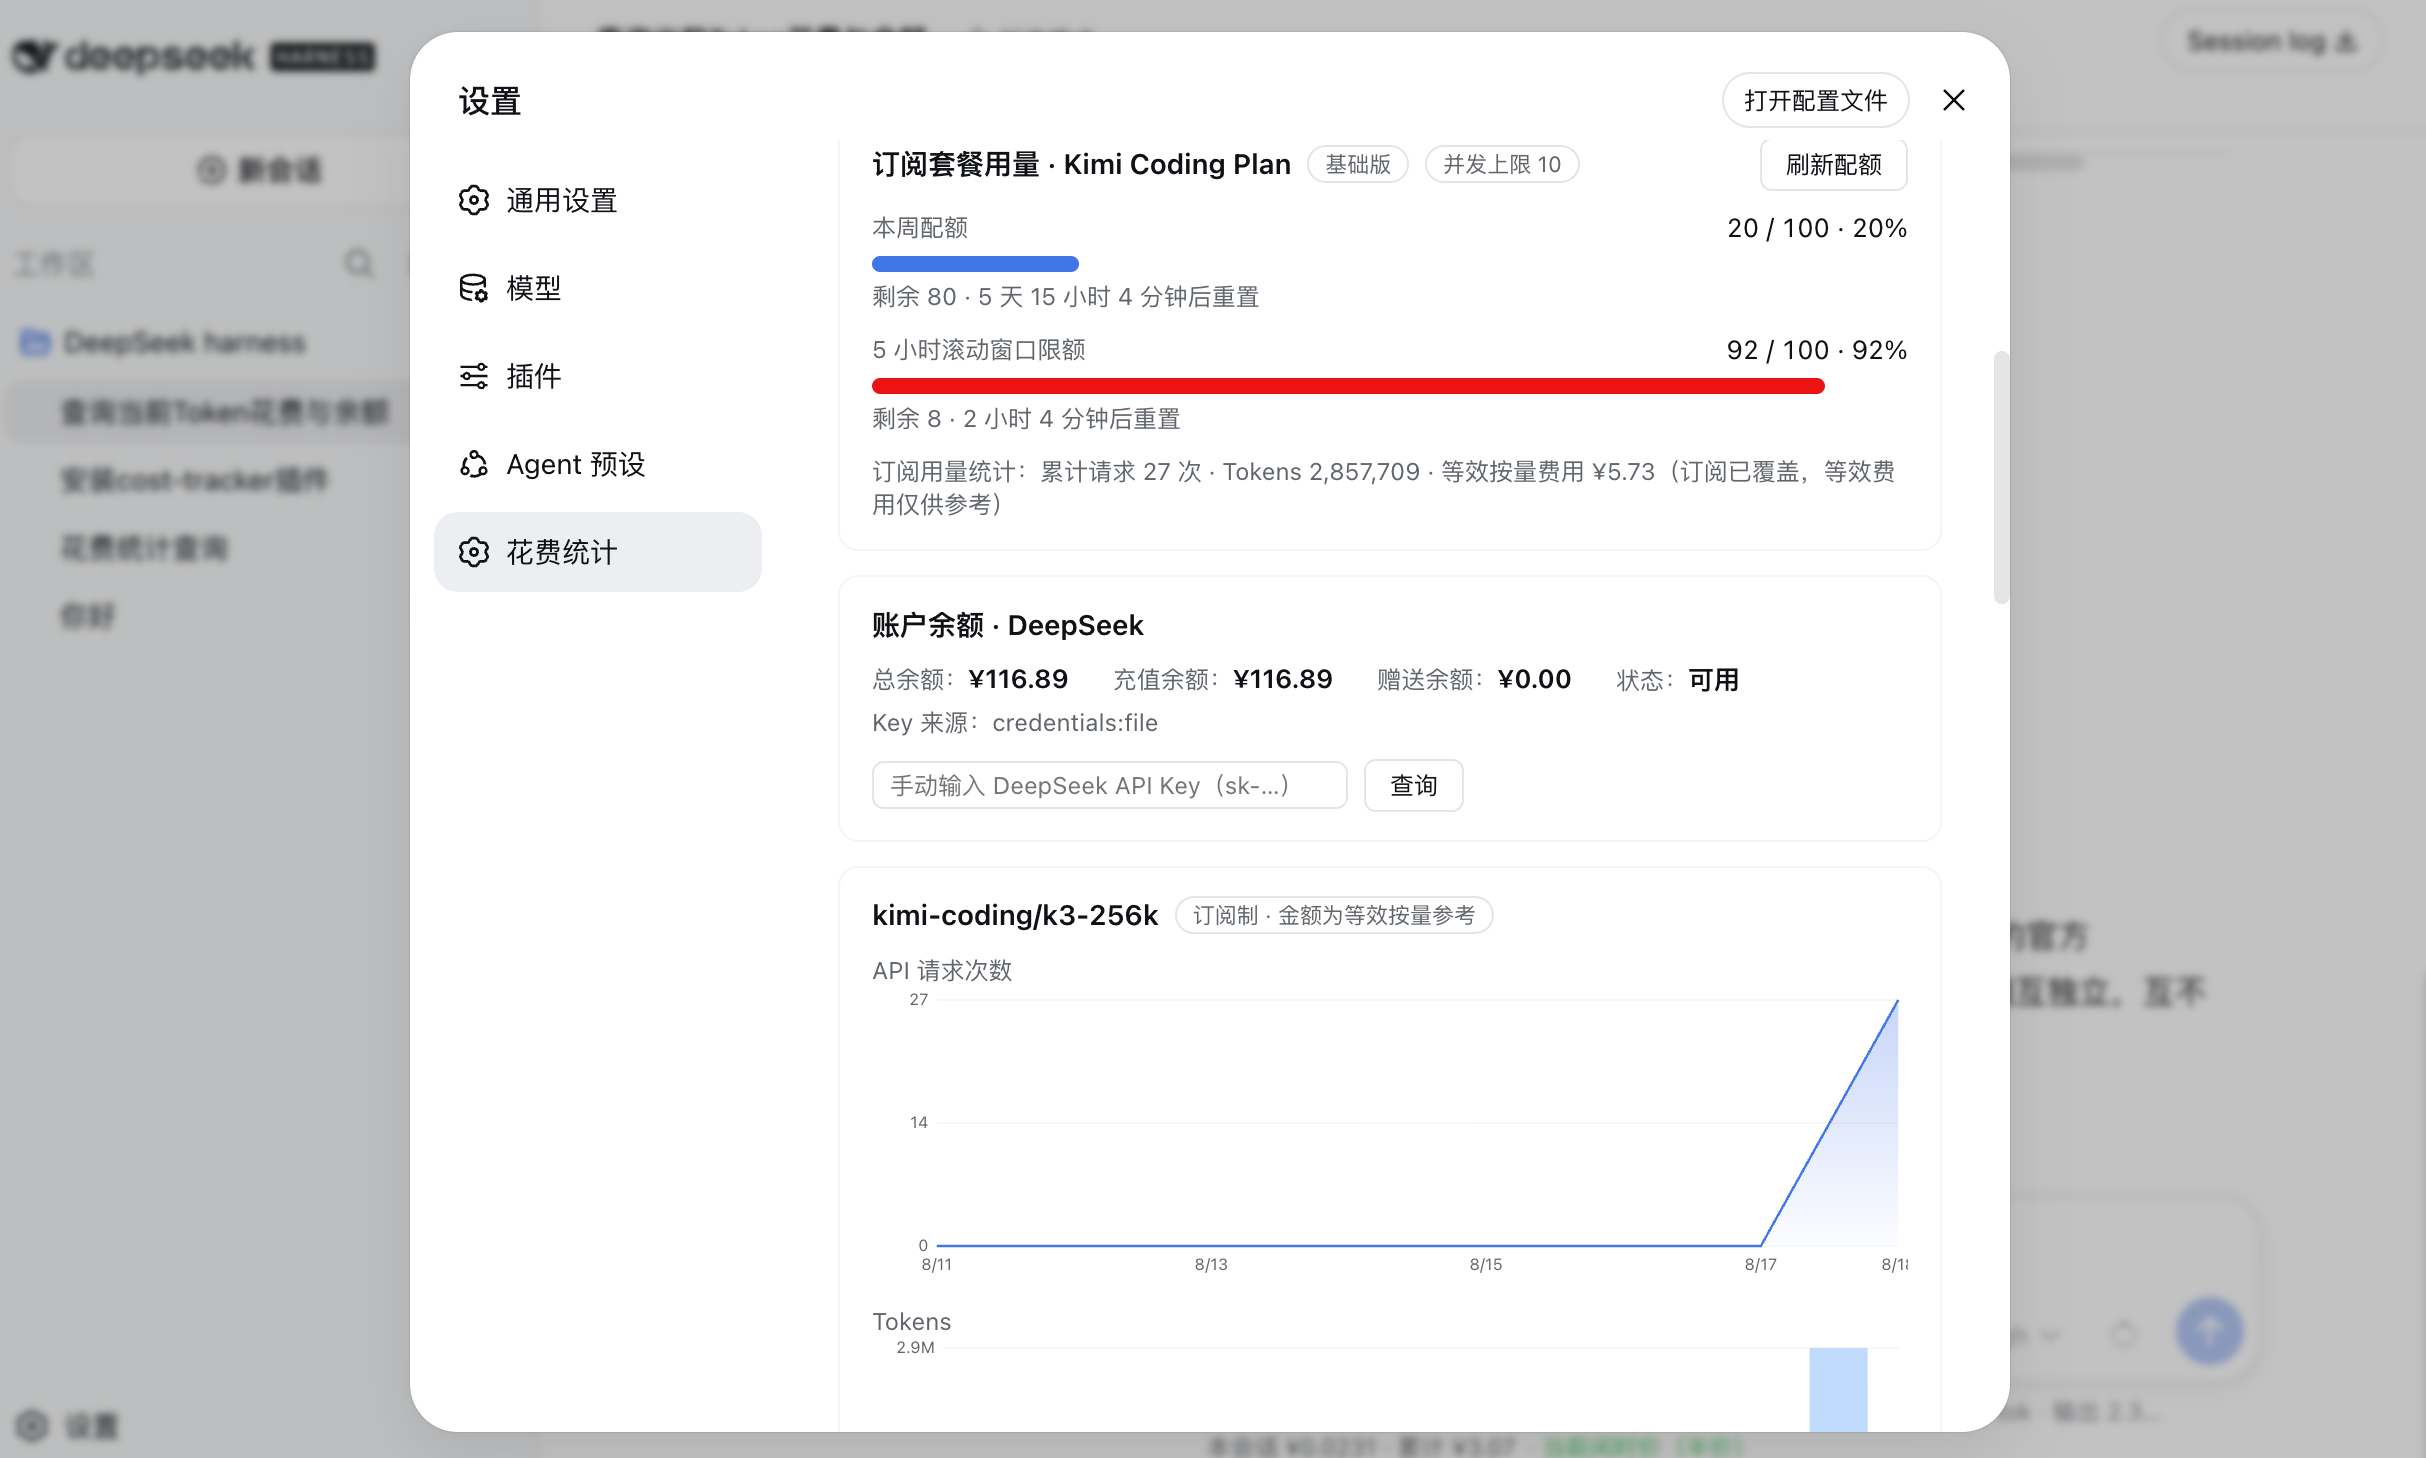
| 📈 | Subscription quota | Kimi Coding Plan and Volcengine Ark Coding Plan: quota progress bars, reset countdowns and pay-as-you-go-equivalent cost for reference. Volcengine is queried through the Ark control-plane OpenAPI (HMAC-signed), requiring an AccessKeyID + SecretAccessKey pair |
| 💳 | Balance lookup | One-click DeepSeek account balance (total / topped-up / granted / status) |
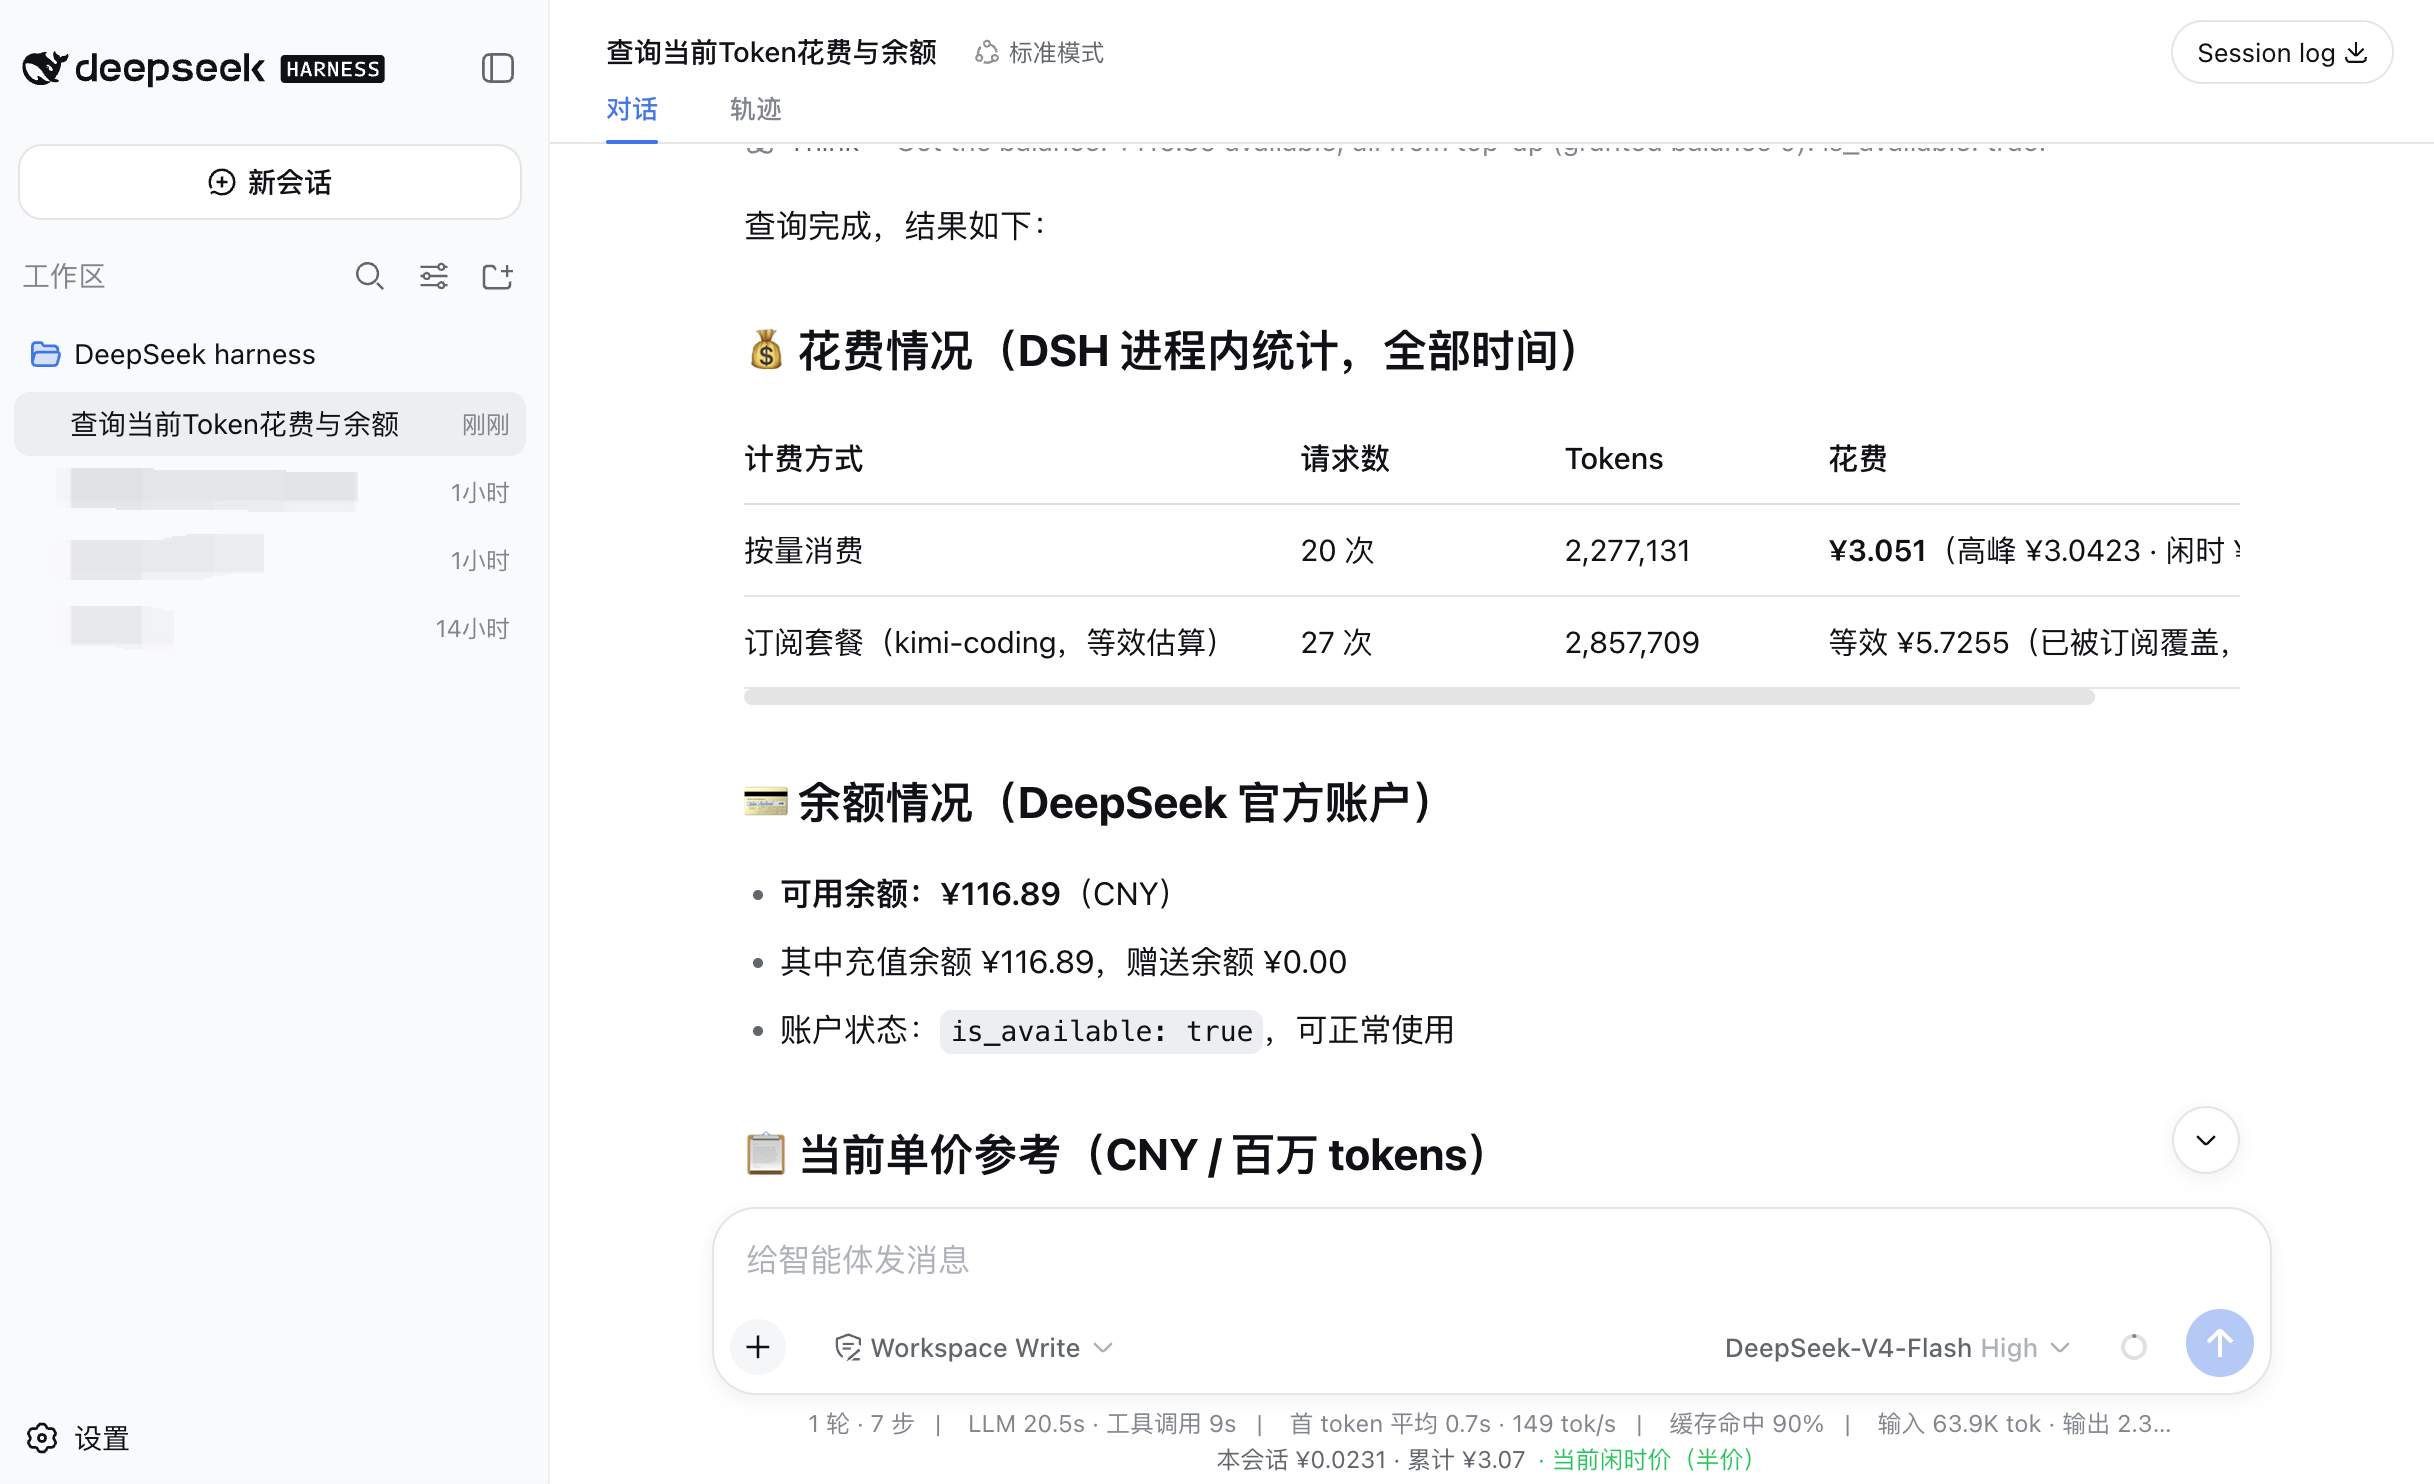
| 🤖 | Agent tools | Ask in any chat: "how much have I spent today?" — the agent answers via cost_stats / cost_prices |
| 🔻 | Status line | A live line under the chat input: session cost (segmented pills: session / subscription plan / per-model), split by the models actually used in the session; multi-model collapses to top2 by default, click to expand. Subscription shows the plan name; no quota or call-count clutter |
| 🔥 | Usage heatmap | A "Token Usage" panel in Settings: a Codex-style 26-week daily-usage grid, colored per-day by input / cache / output / cost with hover details and a today outline; all-time totals shown on top |
| 💾 | Local persistence | Data lives in ~/.dsh/storages/cost-tracker-records.json; survives restarts, never leaves your machine. Details are kept for the last 180 days; older records are auto-compressed into permanent daily rollups, so all-time stats stay exact with bounded memory/disk |
| 🕰️ | History import (v1.9.0) | Replays host session logs to backfill calls made before you installed the plugin (each priced by its own timestamp); only calls the plugin could not have recorded (pre-install / downtime gaps); idempotent, and imported records are tagged source=import |
| 🔄 | Official price sync (v1.9.0) | Fetches the official pricing page, parses each model's peak price and shows the diff; applying builds a new pricing era that only affects later records (history never shifts). The daily check only reports diffs and never auto-applies; a restructured page aborts instead of writing a wrong price |
| 🌐 | Multi-vendor price catalog (v1.9.0) | 14 vendors / 90 entries (USD→CNY at a configurable rate), so models outside the built-in table (OpenAI / Anthropic / Gemini / Qwen …) get exact prices; fuzzy or exact matching plus manual price overrides |
| ⚖️ | Plan vs metered dual basis (v1.9.0) | One "Include Plan total" switch changes the basis: off = metered spend only, with subscriptions shown as a footnote; on = metered + subscription equivalent, merged into the charts as its own segment |
| 🔐 | No plaintext secrets (v1.9.0) | The cloud token and the Volcengine secret live only in the DSH credential store (legacy plaintext migrates on startup); responses only report booleans; every outbound request goes through a host allowlist with forced https and no cross-host redirects |
| 📤 | CSV export | One-click export of details + daily rollups (purpose=rollup) for further analysis in Excel / Numbers |
Screenshots
Ask the agent directly — built-in cost/balance/price tools with a live status line under the input box:
Subscription quota & account balance — progress bars, reset countdowns and balance at a glance:
Per-model details — request trends and token composition per model, with hover tooltips:
Installation (choose one)
Prerequisite: you already run DSH in web mode (
dsh web).~/.dshbelow means the DSH home directory (${DSH_HOME:-$HOME/.dsh}).One caveat for Option A: the plugin marketplace itself requires
dsh web ≥ 0.1.0-rc.6. On an older host the Plugin Marketplace entry never appears at all — in that case use Option B or Option C.
Option A: Install from the plugin marketplace (recommended)
This plugin is listed in the curated awesome-dsh-plugin catalog (category usage). Open Settings → Plugin Marketplace inside DSH, search for dsh-cost-tracker and press install. The equivalent command line is:
dsh plugin --profile web add @angelyeye/dsh-cost-tracker
You can also install straight from the repository with
dsh plugin --profile web add github:Angelyeye/dsh-cost-tracker. It yields the same package: the name comes from the bundle's ownpackage.json, so the graph row id — and therefore the client-registration requirement — is identical either way.
The marketplace installs the plugin into your profile and writes the loader config for you. It installs the latest published version — no manual git clone, no hand-editing the patch file. Restart dsh web and refresh the browser when prompted.
Option B: Let DSH install it for you (no CLI knowledge needed)
Open any DSH session and paste this prompt verbatim to the agent:
Please install the DSH plugin @angelyeye/dsh-cost-tracker for me:
1. git clone https://github.com/Angelyeye/dsh-cost-tracker.git into ~/.dsh/profiles/node_modules/@angelyeye/dsh-cost-tracker (the directory MUST match the package name)
2. Append to the top-level array of ~/.dsh/profiles/web/cordis.patch.yml:
   - insert:
       - id: dsh-cost-tracker
         name: "@angelyeye/dsh-cost-tracker"
3. Tell me when done — I will restart dsh web myself
Then stop dsh web with Ctrl+C, start it again, and refresh your browser.
Option C: Manual install (3 commands)
# 1. Download the plugin (directory name must match the package name)
mkdir -p ~/.dsh/profiles/node_modules/@angelyeye
git clone https://github.com/Angelyeye/dsh-cost-tracker.git ~/.dsh/profiles/node_modules/@angelyeye/dsh-cost-tracker

# 2. Register the plugin (append to the patch file)
cat >> ~/.dsh/profiles/web/cordis.patch.yml <<'EOF'
- insert:
    - id: dsh-cost-tracker
      name: "@angelyeye/dsh-cost-tracker"
EOF

# 3. Restart DSH (Ctrl+C the running dsh web first)
dsh web
Verify it works
- Open the DSH Web GUI → Settings (bottom-left) → a "Cost Statistics" entry appears in the sidebar;
- A cost status line shows up under the chat input;
- Ask the agent "check my current spending" — a correct answer means everything is ready.
⚠️ If
~/.dsh/profiles/web/cordis.patch.ymlalready contains entries, keep them and only append the block above; the file's top level must remain a YAML array.
⚠️ On a machine where this plugin was installed from the marketplace, never upgrade by copying files by hand (a real trap hit in v1.9.1): DSH profiles manage plugins with pnpm (
~/.dsh/profiles/web/package.jsonrecords"@angelyeye/dsh-cost-tracker": "^1.8.15"), so on the next start the marketplace reconciliation reinstalls the pinned older version and overwrites your files — the symptom is "upgraded, restarted, and it is the old version again". For those machines, link the checkout into the profile instead (survives restarts, and a restart picks up your edits):dsh plugin --profile web add link:/path/to/dsh-cost-trackerFor released versions just upgrade normally:
dsh plugin --profile web update(or the marketplace's update button).
Migrating from the old package name (only installs of v1.6.0 or older)
As of v1.7.0 the package name changed from dsh-cost-tracker to @angelyeye/dsh-cost-tracker — the old name is held on npm by an unrelated package, and the marketplace's npm mapping requires the published name to equal the repository's package.json name.
⚠️ The v1.7.0 migration guidance has been corrected. v1.7.0 shipped a client-registration defect (see the v1.7.1 entry in
CHANGELOG.md): the client half fails to load for every install of v1.7.0, whichever way it was installed. Install v1.7.1 or newer — do not troubleshoot by reinstalling v1.7.0. Installing from the repository does not help either: the package name is the same, so the graph row id is the same, and the fault is inside the bundle.
⚠️ Do not simply install the new version on top of the old one. Both versions' cordis.patch.yml insert the same loader id (dsh-cost-tracker), so stacking them loads both copies — duplicated HTTP routes, agent tools and UI slots. Remove the old one first:
Marketplace install (installed via dsh plugin add):
dsh plugin --profile web remove dsh-cost-tracker
dsh plugin --profile web add @angelyeye/dsh-cost-tracker
Manual clone install:
# 1. Edit ~/.dsh/profiles/web/cordis.patch.yml and remove the - insert: block whose id is dsh-cost-tracker (4 lines)
# 2. Delete the old directory
rm -rf ~/.dsh/profiles/node_modules/dsh-cost-tracker
# 3. Reinstall once via Option A above
Note: if you delete the old directory but leave that
- insert:block incordis.patch.yml, DSH fails to resolve the module namedsh-cost-trackerat startup and the profile will not load. Handle both together.
No data is lost: usage records live in ~/.dsh/storages/cost-tracker-records.json, independent of the plugin directory, the package name and the install method.
Usage
The Settings dashboard
- Time range: switch between last 7 days / 30 days / all time (top-right);
- Six overview cards: Today / This month / Total spend / API requests / Tokens / Account balance. The three spend cards exclude subscription equivalent cost (shown as an annotation); month is by Beijing calendar month; total is all-time (details + permanent rollups, always exact);
- Cost chart: segment by peak period or by model; hover for daily breakdowns;
- Color schemes: in "by model" view, three swatches next to the title switch between 橙→黄 / 蓝→紫 / 蓝→浅蓝 palettes. Models are ranked by total spend and colored in a sequential gradient (rank 1 = darkest at the bottom, getting lighter upwards; no cycling, no collisions). The choice is remembered in the browser (localStorage);
- Per-model sections: one request-count chart and one token-composition chart (input / cache write / output / cache hit) per model;
- Usage heatmap: a Codex-style 26-week daily-usage grid; shade by the day's token count relative to the maximum; hover any cell for that day's breakdown (input / cache / output / cost), today outlined; the scope follows the three-state switch: "local" counts this machine only, "local + cloud" merges the cloud's per-day usage (same union scope as the cards above, no double counting), "cloud only" shows the cloud alone, with the active scope labelled next to the title. Cloud per-day detail requires
dsh-cost-cloud ≥ v1.3.2; on an older cloud it falls back to the local scope; - Peak/off-peak pricing & notice: pick the tier strip style (compact single-row — a 24h-proportional bar with a white real-time line / ring dial — a 24h hollow dial with a phase-colored dot), optionally switch the compact strip to a two-row compact stacked layout (bar-above-text or text-above-bar), toggle the "Show time" tick labels (00:00–21:00), set the popup-alert lead time (1–30 min), alert type (both / entering peak / entering off-peak), popup position (bottom-right / center), and optional browser system notification; everything auto-saves. A persistent strip in the sidebar footer shows the current tier and countdown to the next switch;
- CSV export: exports detail records (last 180 days) plus daily rollup rows (
purpose=rollup).
Agent tools
| Tool | Purpose | Example prompt |
|---|---|---|
cost_stats |
Query usage & cost statistics (scope=local (default, this machine) / cloud (all machines) / both) |
"How much did I spend today?" · "What did all my machines cost together?" |
cost_prices |
Show the built-in price table & peak rules | "What does deepseek-v4-flash cost right now?" |
cost_peak |
Show the current peak tier & next-switch countdown | "Is it peak hour right now?" |
cost_recompute |
Re-price stored records by pricing era (one-off backfill), dry-run by default | "Re-price the records from before the price change" |
cost_import |
History import: show status / run one backfill pass (calls from before the plugin was installed) | "Include what I spent before I installed the plugin" |
cost_sync |
Cloud sync: status / sync now / test connection / update config | "Sync my usage to the cloud" · "Is cloud sync healthy?" |
cost_reset |
Erase ALL statistics (irreversible) | "Reset my cost statistics" |
Multi-machine aggregation (cloud sync, v1.8.0)
Running DSH on several computers? Send usage to your own self-hosted cloud service and see the network-wide totals — broken down by device and by agent — from any of them.
Deploy the service (separate repo, zero runtime dependencies):
git clone <your repo url> dsh-cost-cloud && cd dsh-cost-cloud
cp .env.example .env      # fill SESSION_SECRET and ADMIN_PASSWORD_HASH (node scripts/hash-password.js "pw")
docker compose up -d      # open http://<server>:8787 and generate a shared bootstrap token under Settings
Configure each device: open Settings → Cost Tracker → gear icon (top right) → "Multi-machine aggregation (cloud sync)" and fill in:
| Field | Meaning |
|---|---|
| Device name | How this machine shows up on the dashboard |
| Service URL | e.g. https://cost.example.com |
| Shared token | the dshc_... value from the cloud Settings page |
| Sync interval | 60s by default |
Then hit Test connection → Sync now. Back in Settings → Cost Tracker the view switcher appears:
| View | Meaning |
|---|---|
| This machine | local-only (identical to running without cloud sync) |
| This machine + cloud | this machine + all other devices + the other agents running on this machine (server-side union, nothing double-counted) |
| Cloud only | cloud records only (includes this machine's synced part) |
The union behind "This machine + cloud" is
other devices∪non-DSH agents on this machine. So with several machines and mixed agents: this machine's DSH numbers come from local storage, its ZCode/Codex (etc.) numbers come from the cloud, and every other computer comes from the cloud — the three add up to exactly the whole network, with nothing counted twice or missed.
The dimension selector adds per-device / per-agent / per-model breakdowns and a device × Agent matrix (row totals = column totals = grand total).
Other agents can report too: the ingest protocol is open. Any agent's stats plugin that implements docs/INGEST-API.md in the dsh-cost-cloud repo is aggregated with no server changes, and a new agent column shows up automatically.
Key rule: every agent on the same machine must share one machineId (the shared ~/.dsh-cost/device.json file); otherwise one computer is counted as several devices.
Privacy: only token counts, cost, timestamps and identifiers are uploaded — never prompts, responses, file paths or code. The config card offers "mask session id" (irreversible hash) and "omit purpose".
Interface visibility (v1.8.12, optional)
Don't want the plugin in your face? Settings → Cost Tracker → gear icon (top right) → Data & interface → Interface visibility has three independent switches that apply the moment you tick them (no Save, no dsh restart):
| Switch | What turning it off does |
|---|---|
| Composer cost pill | the per-session cost / model breakdown above the chat input disappears |
| Sidebar peak bar | the phase / countdown strip at the bottom of the sidebar disappears (the peak-switch popup and web notifications go with it; if you only want the reminder without the strip, use the notice switch under "Peak/off-peak pricing & notices" instead) |
| Settings dashboard | the Settings nav entry keeps a one-line hint on how to bring the dashboard back (accounting and cloud sync keep running) |
- Display only: accounting, persistence, cloud sync and the agent tools (
cost_statsetc.) are unaffected; - The configuration entry itself is never hidden by these switches — the header gear always stays (old hosts also keep the plugin configuration card), otherwise you would have no way to turn them back on;
- Truth value is "hidden only on an explicit
false", so a missing key means visible: an existing config file looks exactly the same after upgrading; - All three keys live in the same
~/.dsh/storages/cost-tracker-config.json(uiDockEnabled/uiPeakEnabled/uiDashboardEnabled) and never overwrite the peak/cloud fields.
Settings entry (v1.9.3: the gear in the Cost Tracker header; the only entry on new hosts)
Settings → Cost Tracker → gear icon at the top right (icon button, tooltip "花费统计设置") opens the configuration page; the back control at its top-left returns to the dashboard.
| Entry | Host versions | Shape |
|---|---|---|
| Header gear → configuration page (v1.9.3, recommended) | all versions | Settings → Cost Tracker → gear; the page is fully expanded, back control at the top left |
| Plugin configuration card (v1.9.0, kept for compatibility) | only hosts that still declare settings.plugin.item (dsh < 0.1.7-alpha.2) |
Settings → Plugins → Plugin configuration → Cost Tracker; collapsed by default, click the header to expand |
DSH
0.1.7-alpha.2removed thesettings.plugin.itemslot (the Built-in plugins section became a read-only inventory), so the card no longer shows on new hosts. The registration is kept (an undeclared slot simply never fires, so it costs nothing) and old hosts keep working. Both entries share one configuration component, so fields, validation and write paths are identical — only the shell differs; unsaved drafts are independent, just edit wherever you are.
The configuration page carries all settings, laid out as collapsible groups under a status strip (cloud sync / records stored / pending / last sync / pricing era / history import / amount basis):
| Group | Contents |
|---|---|
| Multi-machine aggregation (cloud sync) | device name, enable switch, service URL, shared token, interval, batch size, session masking, purpose, rollup upload, backfill window, default view + Save / Test / Sync now / Full re-send + device id / watermark / last error |
| Peak/off-peak pricing & notices | peak switch, prominent notice, strip style (compact / dial), tick labels / two-line compact, switch alerts (lead time / target / position / web notification) + live preview while editing |
| Subscriptions & quotas | Volcengine Ark AccessKeyID / SecretAccessKey (the secret goes to the credential store only), quota query with percentage bars, subscription classification overrides (provider/* or provider/model → plan / pay-as-you-go) |
| Pricing & price catalog | "Include Plan total" switch, catalog match mode (fuzzy / exact), USD→CNY rate, manual price overrides, official price sync (check / apply / last diff / current era / synced eras), multi-vendor catalog overview (vendors, entries, data date, fingerprint) |
| History import | auto-import switch, import now, totals and processed log count, the three coverage rules |
| Data & interface | the three interface-visibility switches (instant), CSV export, cost recompute (dry-run / write back), clear data (two-step confirm) |
| Security & credentials | "configured + storage location" badges for the cloud token and Volcengine secret, legacy plaintext migration state, clear buttons, egress-protection notes |
Only the three interface switches apply instantly; every other group is "edit draft → save that group", so a stray click can never write to disk. Collapsing a group only toggles CSS visibility (nothing unmounts), so opening one never refetches data or loses your draft.
History import (v1.9.0)
Conversations from before you installed the plugin can be backfilled: the plugin replays the host session logs ($DSH_HOME/sessions/<project>/<session>/session.v3.jsonl.zstd, decompressed frame by frame — the host appends one zstd frame per batch) and books each model call at the price era of its own timestamp.
- Auto-import on startup by default (8 s delay, never blocks the boot), with an "Import now" button and an
autoImportswitch; - Only calls the plugin could not have recorded: earlier than this machine's first live record, or on a day with no live coverage at all (downtime gaps);
- Sessions straddling the install point are cut at that session's first live record: the earlier part is backfilled, the later part stays live-recorded;
- Idempotent three ways: a manifest fast-skips unchanged logs by mtime+size; every call is deduped by
(sessionId, timestamp, five token buckets); days already covered by live data are skipped rather than double-counted; - Imported records are tagged
source=import(live ones aresource=live); forked sessions only count events aftercreatedAt, and auxiliary requests (title generation) never produce records.
Official price sync & multi-vendor catalog (v1.9.0)
- Official price sync: "Check official prices" fetches the official pricing page (the Chinese page gives CNY directly), parses each model's peak price and diffs it against the currently effective table; "Apply new prices" turns the result into a new pricing era that only affects records at or after the apply moment — history keeps its own era, so past numbers never shift. A daily automatic check (on by default) only reports diffs and never auto-applies. The parser refuses to write anything on page restructures, missing numbers, or an off-peak price that is not exactly half the peak price;
- Multi-vendor price catalog: 14 vendors / 90 model entries (OpenAI, Anthropic, Google, Moonshot, z-ai, xAI, Alibaba, MiniMax, Tencent, Xiaomi, Upstage, NVIDIA, Mistral, OpenCode; data adapted from
dsh-cost-meter's verified catalog, MIT), converted with a configurable USD→CNY rate (default 7.2). Models outside the built-in table are billed as exact prices instead of "estimated"; fuzzy (normalized containment) or exact matching; - Manual price overrides per
provider/model(input / output / cache) take the highest priority — for self-hosted endpoints or negotiated deals; - Resolution order: manual override > subscription classification > built-in / synced era > catalog > provider fallback > generic fallback.
cost_pricesand/api/cost-tracker/pricesreport the current era, synced eras, catalog fingerprint and overrides; - The cloud service (
dsh-cost-cloud ≥ v1.4.0) implements the same rules with its own admin endpoints, and/api/v1/protocolreports which price version the cloud is actually using.
Credential safety (v1.9.0)
- No secrets on disk: the cloud shared token and the Volcengine
SecretAccessKeylive only in the DSH credential store (~/.dsh/.credentials.yaml); the config file keeps nothing but a boolean. Plaintext left behind by v1.8.x (including the base64-obfuscated secret) is migrated automatically on startup and removed from the config (idempotent; an existing credential-store value is never overwritten). Safety boundary: plaintext is only removed when the credential store is actually writable — if the host exposes no credential service (or a read-only one), the plaintext is kept as is with a startup notice, because a secret that only lives in memory is gone after a restart; - No response ever echoes a secret: status endpoints return only booleans plus the storage location (credential store / process memory).
AccessKeyIDis a non-sensitive identifier and is echoed so the form can be pre-filled; - Egress protection: any request carrying credentials must match the host allowlist (DeepSeek / Kimi / Volcengine control plane / your configured cloud URL / the pricing page host), non-loopback hosts must use https, and
redirect: 'manual'is forced — any 3xx is treated as a failure so a redirect can never carry theAuthorizationheader elsewhere.
HTTP API (for other tools)
All endpoints are POST + JSON and listen on the loopback address:
POST /api/cost-tracker/summary      Overview
POST /api/cost-tracker/dashboard    Dashboard data
POST /api/cost-tracker/usage        Usage heatmap (all-time totals + daily token aggregation)
POST /api/cost-tracker/peak         Peak-phase snapshot (current tier / next switch / config / interface visibility)
POST /api/cost-tracker/peak-config  Save peak-price notice config
POST /api/cost-tracker/ui-config    Save interface-visibility switches (pill / sidebar bar / dashboard; partial patches OK)
POST /api/cost-tracker/sync         Cloud sync status (device id / watermark / pending / last error / interface visibility)
POST /api/cost-tracker/sync-now     Sync now ({"full":true} to re-send everything)
POST /api/cost-tracker/sync-test    Test the cloud connection
POST /api/cost-tracker/sync-config  Save cloud sync config
POST /api/cost-tracker/cloud        Read-only cloud aggregation (route/days/excludeSelf/devices/sources)
POST /api/cost-tracker/kimi-usage   Kimi subscription quota
POST /api/cost-tracker/volcengine-usage  Volcengine Ark Coding Plan quota (5-hour / weekly / monthly windows)
POST /api/cost-tracker/volcengine-config Save Volcengine AK/SK (reports only whether keys are configured, never the keys)
POST /api/cost-tracker/balance      Account balance
POST /api/cost-tracker/prices       Price table (by pricing era + synced eras + multi-vendor catalog + overrides)
POST /api/cost-tracker/recompute    Re-price stored records by era (dry-run unless {"apply":true})
POST /api/cost-tracker/billing-config  Billing basis & catalog config (amount basis / plan overrides / match & fx / price overrides)
POST /api/cost-tracker/prices-sync  Official price sync (dry-run unless {"apply":true})
POST /api/cost-tracker/prices-config Price-sync settings (pricing page URL / daily auto-check)
POST /api/cost-tracker/import-status History-import status
POST /api/cost-tracker/import-run   Run one history-import pass (idempotent)
POST /api/cost-tracker/import-config History-import settings (auto-import on startup)
POST /api/cost-tracker/reset        Clear every record (called after the card's two-step confirm)
POST /api/cost-tracker/export       CSV export
Example: curl -X POST http://127.0.0.1:3080/api/cost-tracker/summary -d '{}'
Changelog
Highlights only — the full version-by-version history lives in
CHANGELOG.md(Chinese).
v1.9.5 (2026-10-07)
Fix "the whole Cost dashboard renders as unstyled native controls in the Desktop (Electron) app": the plugin's own <style> lacked a data-plugin ownership tag, so another module claimed it and HMR cleanup deleted it along with its own styles
- Root cause (reproduced): DSH 0.2's
@deepseek-ai/dsh-client-modulescallsclaimStyles(ownerId), which claims every<style>that has nodata-pluginfor whichever module is materializing at that moment, andremoveOwnedStyles(id)deletes all tags taggedidwhen that module is invalidated, reloaded or pruned. The plugin only setdata-plugin-css, so its stylesheet was claimed by@deepseek-ai/dsh-api-remotes— and when that module's styles were torn down, all 170 dashboard CSS rules went with it: card borders, control skins and chart grid vanished, leaving raw<select>/<button>chrome; - Why Desktop only: the Electron shell serves the raw
apps/webvite dist fromdsh-app://app/and applies the boot graph (ModuleLoader bootstrap, plugin preloads, contact config) at runtime over IPC; the manifestdsh-client-hmrthen pushes gives non-managed rows a differentrev, which is exactly what triggers that teardown path.dsh webinlines the boot graph into index.html, so materialization order and revisions differ and the bug never fires there; - Fix:
client.jsnow has a single source of truthDSH_BUNDLE_ID, andapplyStyles()setsdata-pluginbefore appending the tag (byte-for-byte the convention the host's own packages use), plus the host's duplicate-tag guard; - Verification: desktop-equivalent host + headless Edge/CDP at the same viewport as the report — before
the fix the emulated teardown removed the stylesheet and the dashboard became native controls; after the
fix the tag survives,
cssRules.length = 170and all 6 cards keep their styling. 12 new assertions inclient-render[11] andclient-registration[3b]; all 19 test files pass; - How it takes effect: client half only — a hard refresh is enough; the host half's version is bumped to 1.9.5 as well.
v1.9.4 (2026-09-24)
Fix "Volcengine Ark quota response is not valid JSON": the host's global fetch stops decompressing gzip once the undici package is loaded, so the plugin now decodes bodies itself
- Root cause (reproduced locally): as soon as any plugin in the host process imports the npm
undicipackage (dshmarketdoes it statically here;dsh-http-proxy/dsh-web-fetch-httpdynamically), Node's built-infetchno longer decompresses gzip — the response has nocontent-encodingand the body is raw compressed bytes (measured: 560 B of plain JSON without the import, 326 B starting with1f 8bwith it).JSON.parse(await res.text())therefore always fails, which is exactly the quota-panel error; the plugin market reading every package's latest version asnullshares the same root cause (its no-proxy fallback also uses the global fetch); - Fix (two layers, transparent to callers):
safeFetchnow sendsaccept-encoding: identityto ask for uncompressed bodies, and after receiving the body it decompresses by bytes (gzip1f8b/ zlib78xx/br,deflatewhen the header says so); any decompression failure returns the original bytes untouched. Every plugin egress (Volcengine/Kimi quota, cloud sync and reads, official pricing-page fetch) goes through this wrapper, so all of them are covered; - Verification: live end-to-end — with the process polluted by
import('undici')the old path reproduces the exact error, while the fixed path returns the three real windows (100% / 27.08% / 14.77%); newcredstore[5] andvolcengine-host[6] regressions; all 18 test files pass; - Takes effect after a
dsh webrestart (host-half change).
v1.9.3 (2026-09-24)
DSH 0.1.7-alpha.2 support: the configuration entry moved into the Cost Tracker page (gear icon + back control); the old card entry is kept for compatibility
- Why: DSH
0.1.7-alpha.2removed thesettings.plugin.itemslot (the old Settings → Plugins → Plugin configuration page); the Built-in plugins section is now a read-only inventory, anddsh-settingsno longer exposesinstallSection— so the plugin's configuration card could never render on the new host; - What: the configuration UI now lives inside the plugin's own settings section — Settings → Cost Tracker → gear icon (top right) opens the configuration page, whose back control returns to the dashboard. The seven collapsible groups, the status strip and every per-group action (Save / Test / Sync now / price sync / history import …) are unchanged;
- Why an in-page switch instead of a second nav entry: the host settings shell renders a section with
closeonly (renderSlot('settings.section', { close }, { only: active })), so a section has no way to navigate the shell; - Compatibility: the
settings.plugin.itemregistration is kept — on 0.1.7+ the slot does not exist, so the callback never fires (zero cost), while older hosts keep showing the card. Both entries share oneConfigPanel(only the shell differs), so fields, validation and write paths are identical; unsaved drafts stay independent; - No more dead end: when the dashboard is turned off, the header and gear remain, with a one-line hint pointing to "Data & interface → Settings dashboard" (the old card entry no longer exists on new hosts, so this guard is required).
v1.9.2 (2026-09-20)
Pricing correction: V4-Pro is no longer routed to Flash (official retirement plan revoked) + statutory holidays are now off-peak
- Correction: the live official pricing page still lists
deepseek-v4-prowith its own row (peak 9 / 27 / 0.30, half price off-peak, concurrency 500), and the official changelog now reads "we decided to continue serving DeepSeek V4 Pro after 2026-09-14, with billing unchanged". The built-in table had implemented the announced plan from the 09-10 news post ("after 09-14 12:00 alldeepseek-v4-prorequests are routed to V4.1 Flash and billed at Flash rates") as erav41pro, which billed pro calls at Flash rates (input 2 / output 8 instead of 9 / 27) — an understatement of roughly 3.4–4.5×. That era and its route are removed; V4-Pro always uses its own rates (PRICE_ERASis back tolegacy/v41). Zero impact on this machine's ledger (0 of 4393 replayed calls useddeepseek-v4-pro). Caveat: pro records ingested while the route was active have their model name rewritten todeepseek-flash, so a re-price cannot recover them — only replaying session logs can. - New: official rules treat Chinese statutory holidays as fully off-peak (previously only weekends
were excluded, so a holiday weekday was billed 1× too high). 33 built-in days for 2026
(State Council notice); the config card
gains
peakHolidays(empty = built-in,none= disable, or a custom list); make-up workday weekends stay off-peak; the phase wording now distinguishes "weekend all off-peak" from "holiday all off-peak".
v1.9.1 (2026-09-20)
Fixed: cloud sync failed with "method not allowed" (405) — safeFetch dropped the native fetch signature, turning every POST into a GET
- The reverse-proxy log showed the plugin sending
GET /api/v1/ingest/records(it must be POST) → the cloud answered 405, so sync was dead and the watermark never advanced; - Root cause:
index.jspassedsafeFetchwhere a<typeof fetch>was expected —(url, init) => safeFetch(url, {...init})— whilesafeFetchonly readopts.init, somethod/body/content-typewere all dropped. It now accepts both shapes (opts.initwins), with the security policy unchanged; - Two regression guards, because neither unit-testing
safeFetchnor unit-testing the engine catches a composition bug: a unit case that reproduces index.js's exact wiring, and an integration case that runs a fullrunOncethrough it and asserts a real POST; - Also fixed: when the credential service becomes available after the plugin (so the first migration attempt safely kept the plaintext), a
ctx.inject(['credentials'])retry now completes the migration instead of leavingsecretsMigratedfalse forever; - Install note: see the warning under "Verify it works" — copying files into a pnpm-managed profile gets reverted on restart; use
dsh plugin --profile web add link:<checkout>for development.
v1.9.0 (2026-09-27)
Five new capabilities, all settings unified into the plugin-config card, and zero plaintext secrets (pairs with dsh-cost-cloud v1.4.0)
- History import — replays the host session logs (many appended zstd frames, decompressed frame by frame) to backfill calls from before the plugin was installed. Idempotent three ways (manifest fast-skip, per-call dedup key, coverage rule), sessions straddling the install point are cut at the first live record, and imported records are tagged
source=import. Auto-runs on startup (8 s delay, never blocks the boot); new agent toolcost_import; - Credential-egress protection — the cloud token and the Volcengine secret are written only to the DSH credential store (the config file keeps a boolean), legacy plaintext is migrated automatically on startup, and every outbound request goes through an allowlist with forced https and
redirect:'manual'(3xx is a failure, so a redirect can never carry theAuthorizationheader away). No response ever echoes a secret; - Official price sync — parses the official pricing page (a transposed table: columns are models, rows are metric × time band) into a new pricing era that only affects records at or after the apply moment, so history never shifts. Page restructures, missing numbers or an off-peak price that is not half the peak price all abort the sync instead of writing a wrong price. The daily automatic check only reports diffs;
- Multi-vendor price catalog — 14 vendors / 90 entries (USD per 1M tokens, converted at a configurable rate), so models outside the built-in table get exact prices instead of "estimated"; fuzzy/exact matching plus a manual price-override table;
- Plan vs metered dual basis + "Include Plan total" switch — one toolbar switch decides whether the money cards and charts show metered spend only (subscriptions shown as a footnote) or metered + subscription equivalent (a dedicated "subscription equivalent" chart segment). The choice is stored locally and written back to the server config;
- Settings unified + card redesign — Settings → Plugins → Plugin configuration → Cost Tracker is now the single entry point, with seven collapsible groups (multi-machine aggregation / peak pricing & notices / subscriptions & quotas / pricing & catalog / history import / data & interface / security & credentials) under a status strip; the dashboard's peak panel became read-only;
- Tests — four new files (
test/import.test.jssynthesises multi-frame zstd logs,test/price-sync.test.jsalso runs against a real fetched page,test/vendor-catalog.test.js,test/credstore.test.js), plus new client-render assertions for the amount-basis switch and the card groups: 17 test files, all green.
v1.8.15 (2026-09-26)
Fixed: the Volcengine quota panel had no place to enter credentials, and an inference API key was being used as the AccessKeyID
- The panel now has its own credential inputs (the main fix). Previously credentials could only be set through the plugin-config card or by hand-writing environment variables — the panel itself offered nowhere to type, so users saw only "credentials invalid" with no way forward. It now provides
AccessKeyID/SecretAccessKeyfields plus three actions: Query (verifies without persisting), Save (persists to disk) and Clear. The AccessKeyID is echoed back for confirmation; the SecretAccessKey is never echoed (when one is stored, the field hints "leave blank to keep"). A "Volcengine quota" button was added to the toolbar as an entry point — otherwise the panel stays hidden by default and users can never reach it. - Fixed: an inference API key was being used as the AccessKeyID — the real cause of the 401s. When a provider's baseURL points at the Ark coding endpoint, its
apiKeyEnvis an inference API key, while quota queries need an IAMAccessKeyID + SecretAccessKey. The old discovery chain fed that value into the AK candidates, producing a cross-source Frankenstein pair (inference key as AK + an unrelated SK from the credential file). Signing with it always returns 401, and a 401 is a soft failure here, so the plugin only reported "credentials invalid or no permission" — the root cause was undiagnosable. Now AK and SK must come from the same source; inference keys are recognised by name (API_KEY/TOKENwithoutACCESSKEY/SECRETKEY) and excluded; and the message explicitly names the offending variable as an inference key. - Fixed: a
ReferenceError(TDZ) turned soft failures into HTTP 500.keyEnvwas declared insidetrybut referenced incatch, so every failure path (401 / network error / changed shape) threw again during error handling and surfaced as a 500. It is now declared outside. - Fixed:
keyEnvalways showed "unknown" —resolveApiKey()returns{value, source}only, andenvis added byresolveAnyEnv(), so the panel never told you which environment variable to fix. - Safety: an empty string no longer clears a stored secret. Because the secret is never echoed, its field is necessarily blank whenever the panel is reopened; treating that as "clear" would silently wipe a stored secret the moment someone edited only the AK. Only a non-empty secret overwrites, and clearing requires an explicit
clear:true. - Tests:
test/volcengine-host.test.jsgrew to 48 assertions, adding four groups: inference keys must not be treated as AKs (a regression test replicating the real provider config), an empty string must not overwrite a stored secret, editing only the AK still works, and onlyclearclears.
v1.8.14 (2026-09-26)
New: Volcengine Ark Coding Plan support (quota monitoring + equivalent cost)
- Quota panel: a new "Subscription usage · Volcengine Ark Coding Plan" panel in Settings pulls the 5-hour / weekly / monthly windows from the Ark control-plane OpenAPI (
open.volcengineapi.com,Action=GetCodingPlanUsage, HMAC-SHA256 signed), showing used percentage, absolute amounts (derived fromCap) and reset countdowns. Actions fall back in orderGetCodingPlanUsage → GetAFPUsage → GetUsageDetails → GetPersonalPlan, so Agent Plan accounts automatically read from AFP; - Equivalent cost: calls covered by the plan now count toward "subscription equivalent cost" instead of being mislabelled "pay-as-you-go · estimated price";
- Fixed a subscription-gate defect (important): the gate used to match on provider name only, applying subscription rates to every model of that provider. Volcengine Ark mixes plan and non-plan models under one provider, so metered calls were mislabelled as subscription and their amounts vanished from "real spend". It is now gated on provider + model allowlist, and distinguishes dedicated subscription endpoints (baseURL pointing at
/api/coding/v3— the whole provider counts as subscription) from a genericvolcengineprovider (only allowlisted models; endpoint idsep-*are always metered). Kimi's existing behaviour is byte-for-byte unchanged; - Fixed a credential-file defect (important):
.credentials.yamlactually stores keys indented under therefs:section, while the parser only matched unindented top-level keys — so that fallback had silently never worked (masked whenever a host credential service was present). Indentation andrefsscoping are now handled, the path followsDSH_HOME, and the hard-coded~/.dshthat broke redirected deployments is gone; - Credential discovery chain: plugin-config card → DSH credential store →
.credentials.yaml(VOLC_ACCESSKEY/VOLC_SECRETKEYplus several variants) → environment variables. Keys never appear in any response;volcengine-configonly reports whether keys are configured; - Every failure is a neutral notice: missing credentials, no subscription, insufficient permission (needs
ArkReadOnlyAccess+BillingCenterReadOnlyAccess) and changed API shapes all degrade to a neutral notice without affecting recording, sync or other features. Users who only run DeepSeek or Kimi see a completely unchanged UI (the panel appears only when relevant); - Adds
volcengine.js(signing / parsing / querying, pure and unit-testable) plus two test files covering fixed signature vectors that match Volcengine's official demo byte-for-byte, four response shapes, 0.5% not being scaled to 50%, zero key leakage, cache TTL and soft-failure paths. Verified against the live API (GetCodingPlanUsagereturningStatus: Runningand three windows).
v1.8.13 (2026-09-25)
Added: the plugin's front-end surfaces can now be turned off (three independent switches)
- Settings → Plugins → Plugin configuration → Cost Tracker → Interface visibility: the composer cost pill, the sidebar peak bar and the Settings "Cost Tracker" dashboard can each be switched off on their
…
Links
More in this category
bowenliang123/dsh-context★ 2079
DSH context insight panel: Context dashboard + /context command + Context browser — one-stop context lifecycle management with categorized composition, content details, evolution trends, compaction/injection events, and stats.
Han-1413141/dsh-cost-meter★ 408
Per-session and daily API cost, budget with usage %, official balance, history dashboard, and one-click official price sync with peak/off-peak pricing.
wssfk12138/dsh-damage-pulse★ 263
Tracks DeepSeek token usage, per-call and session costs, and account balance with cache-aware charge animations in the DSH Web UI.
zh667/TokenLedger★ 202
Sidebar usage panel that attributes tokens to the relay site that served each request, read from your existing provider config: today/month/all-time totals, per-site and per-model breakdowns, a year activity heatmap, and New API / Sub2API / DeepSeek balances.
Ychris12138/dsh-usage-stats★ 172
Multi-provider usage dashboard with provider/model token breakdowns, calendar drill-downs, account balances, and OpenCode Go / Z.ai subscription quota tracking.
PolinniZhong/dsh-personal-center★ 118
Personal center for DeepSeek Harness: cross-session usage statistics, per-model cost estimation, global custom instructions, a global font-size adjuster, a data-driven desktop pet with bitmap & vector skins, and a conversation status overview, all local and offline.
Community comments
Comments are public GitHub Discussions. Loading them connects to GitHub and Giscus; a GitHub account is required to post.