按厂商(订阅/官方API)统计用量看板:按供应商/模型拆分 Token、缓存、输出等 KPI,53 周热力图,趋势折线图(今天按小时),模型钻取,费用估算,CSV 导出,以及健康度卡片(TTFT、生成速度、峰值 Context、错误率)。
安装
# npm 包(预构建)
dsh plugin --profile web add dsh-usage-vendor-stats
# GitHub 源码(首次需按提示配置 allowBuilds 构建授权后重试)
dsh plugin --profile web add github:kirigayakazima/dsh-usage-vendor-stats
装任何插件都等于在你的机器上跑第三方代码,权限和你本人一样大——能读你的文件、用你的凭据、访问网络,工具审批管不到它。GitHub 来源的插件还会在安装时执行构建脚本——pnpm 默认拦截,所以安装可能停在 ERR_PNPM_GIT_DEP_PREPARE_NOT_ALLOWED 或 ERR_PNPM_IGNORED_BUILDS;dsh 会打印出需要添加的确切键名,把它加进该 profile 的 pnpm-workspace.yaml 的 allowBuilds 下,重跑一次即可装上。放行构建本身就是一次信任判断:请只安装可信来源,并尽量锁定 commit(github:owner/repo#sha)。
README
English
DeepSeek Harness usage statistics plugin: aggregates API usage by vendor (subscription / official API) × KPI, with a GitHub-style calendar heatmap and daily / monthly dashboards.
Distinct from
dsh-usage-stats(which aggregates by workspace): this plugin uses the vendor (provider) as the primary dimension, auto-detectingmessage.source.providerandmessage.source.modelfromassistant/messageevents, and splits KPIs into tokens / cache hits / output / reasoning.
Features
- Vendor dimension: auto-discovers every vendor used (e.g.
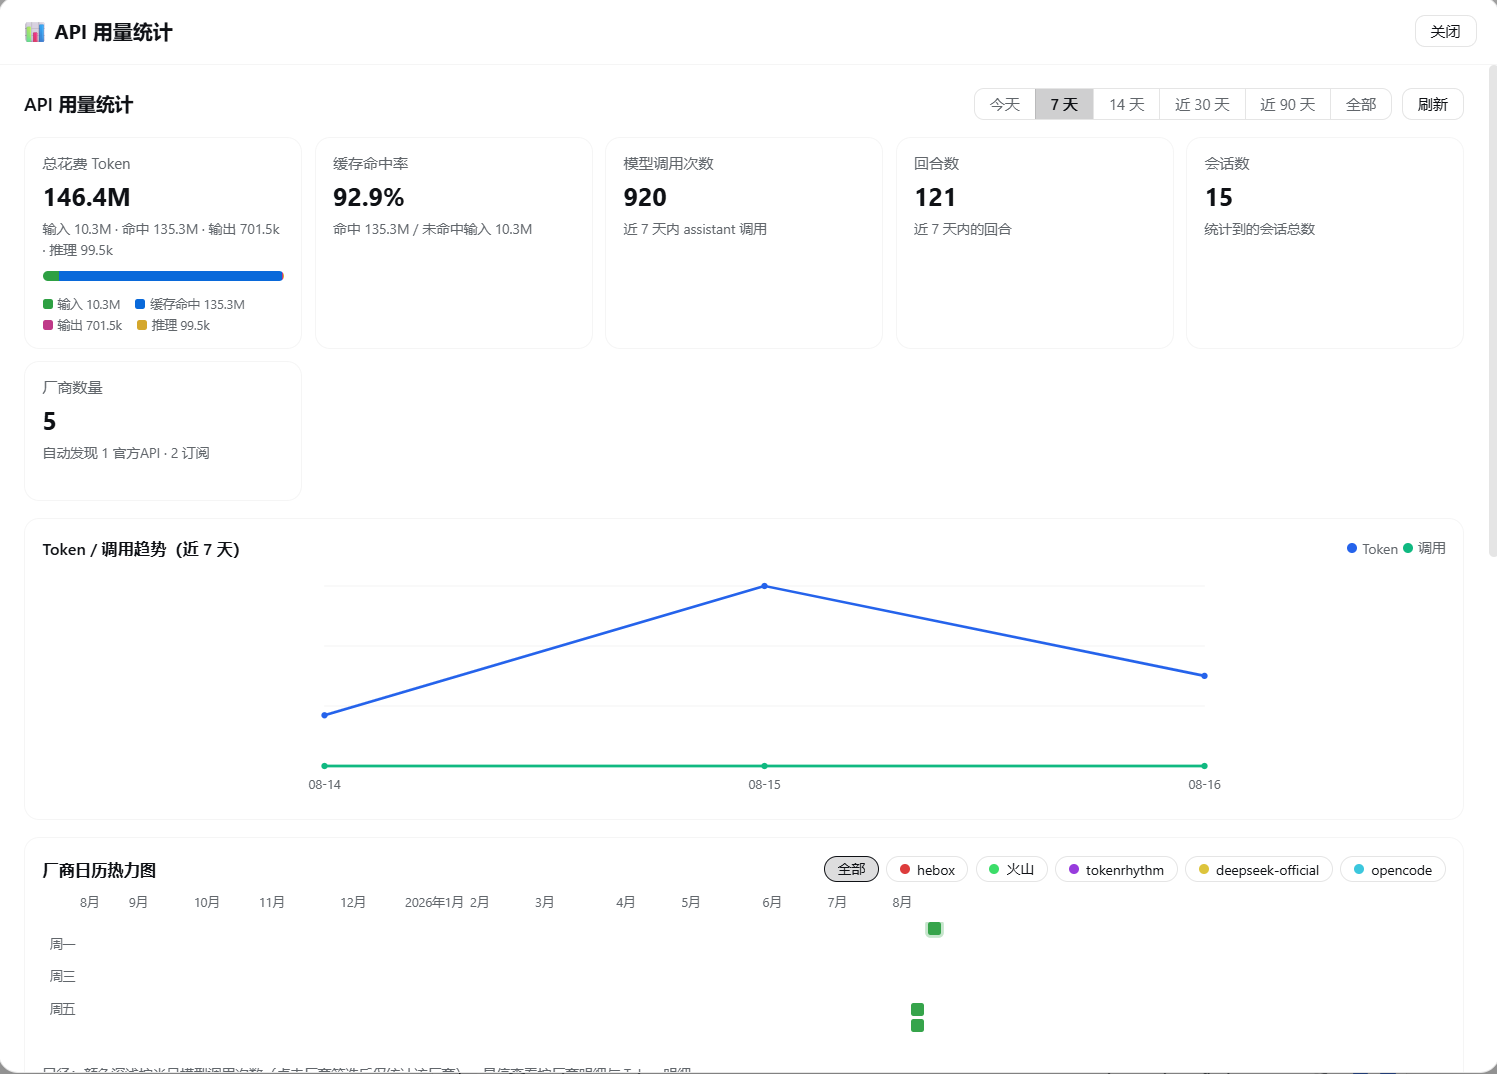
huoshan,hebox,deepseek-official,tokenrhythm,opencode), with manual labels for subscription / official API and aliases (persisted to a KV unit under$DSH_HOME/storages). - KPI cards: total tokens (input / cache hit / output / reasoning breakdown), cache hit rate, model calls, turns, sessions, vendor count, with a multi-color token composition ratio bar.
- 53-week heatmap: GitHub-green style, intensity by daily model calls; click a vendor chip to filter; hover for per-vendor and per-token details.
- Trend line chart: Token / Calls dual-axis trend, per-day by default and per-hour for "today" (hourly aggregation).
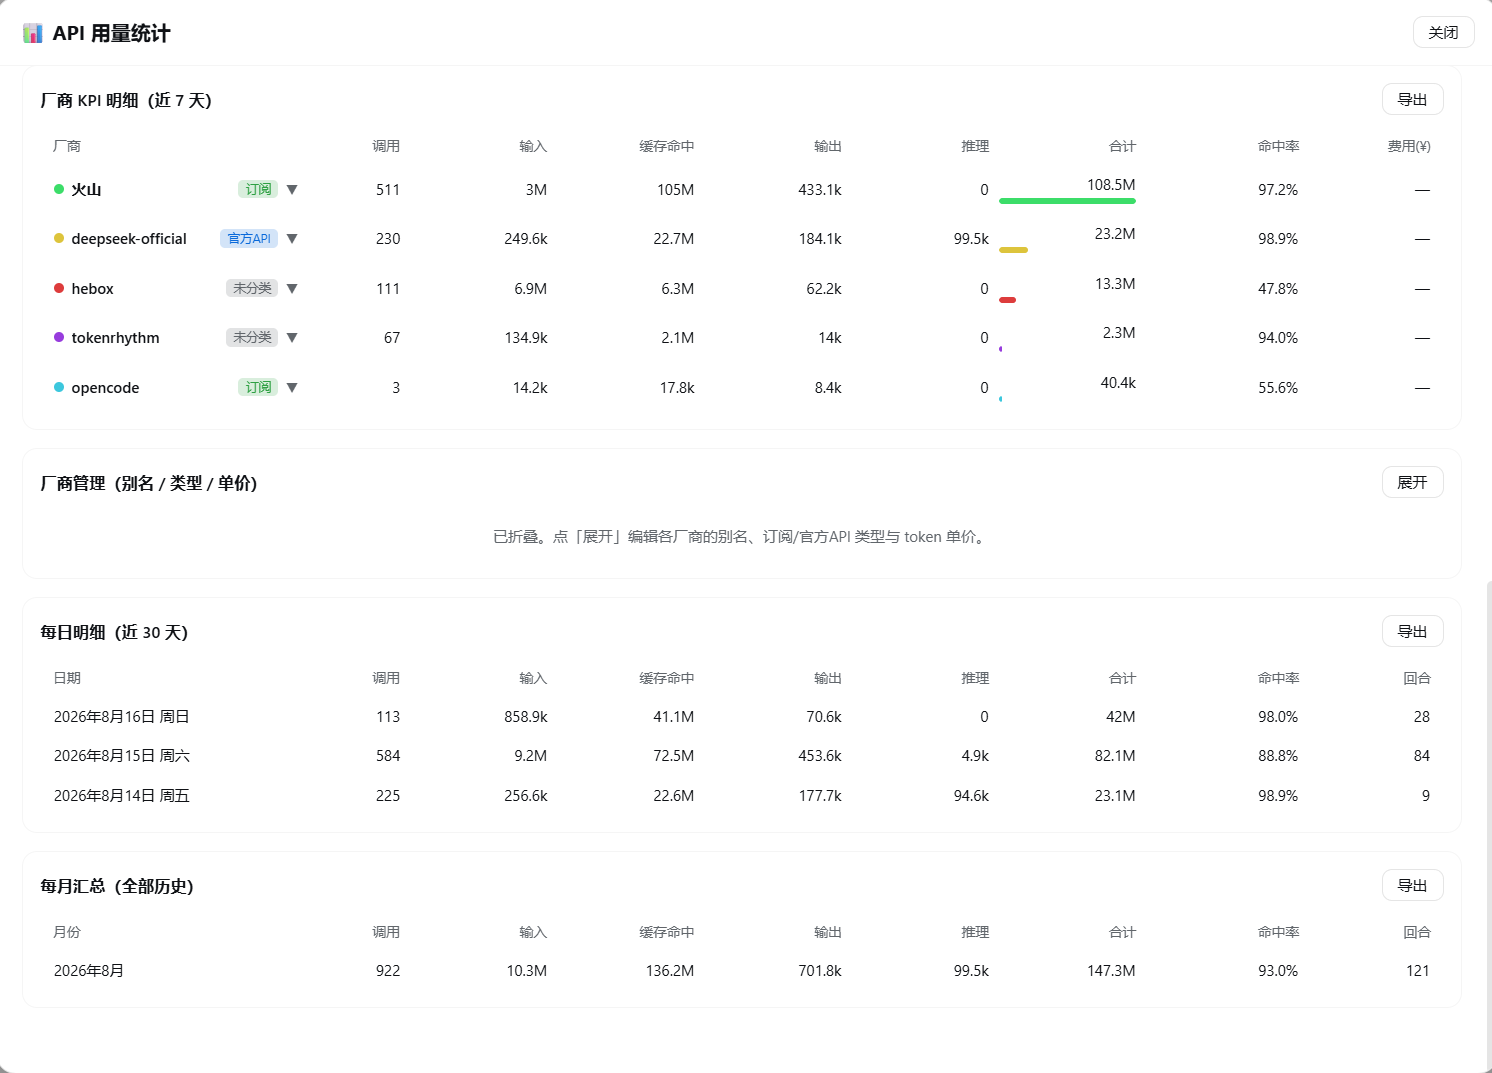
- Vendor model drilldown: click a vendor row to expand its per-model consumption.
- Daily detail: per-day tokens / cache / output / reasoning / hit rate / turns (last 30 days).
- Monthly summary: all history aggregated by month.
- Vendor KPI table: sorted by total tokens, with hit rate, model count, type badge; click a row to drill into models.
- Time presets: today / 7d / 14d / 30d / 90d / all.
- Cost estimation: set a per-million-token unit price per vendor to see an estimated fee column.
- CSV export: export daily / monthly / vendor tables to CSV.
- Health / performance cards: average TTFT (time to first token), generation speed (t/s), peak context size, request error rate, and total model / tool wall time, aggregated from DSH's
sessionStatsprojection. - Range switching, animations, light/dark theme adaptation.
Screenshots
Data source
- All data comes from DSH durable session logs:
assistant/messageevents carryusage(token accounting) andmessage.source.{provider,model}(vendor/model provenance). - Token accounting (consistent with DSH):
inputTokens= uncached input,cacheReadTokens= cached input,outputTokens= output,reasoningTokens= reasoning,cacheWriteTokens= cache write. - Cache hit rate = hits / (hits + uncached input) × 100%.
- History is backfilled automatically on activation; data survives plugin uninstall / restart.
Install
This is a standard DSH community plugin package (declares dsh.bundle manifest + web client half).
From GitHub (recommended)
dsh plugin --profile web add "github:kirigayakazima/dsh-usage-vendor-stats"
Refresh the page after install — no manual config, no restart.
Manual registration (local development)
- Place this directory anywhere and create a symlink pointing to it under
$DSH_HOME/profiles/node_modules/(use a junction on Windows):New-Item -ItemType Junction -Path "$env:DSH_HOME\profiles\node_modules\dsh-usage-vendor-stats" -Target "<absolute path to this dir>" - Add a line to
$DSH_HOME/profiles/web/cordis.patch.yml:
The user patch layer hot-reloads: save and refresh the page.- insert: - id: usage-vendor-stats name: dsh-usage-vendor-stats
Usage
- Open Settings (sidebar footer) and find the API Usage Stats page, or click the 📊 Usage Stats entry in the sidebar footer to open the fullscreen panel.
- Heatmap color = daily call count; click a vendor chip or table row to filter / drill down.
- In Vendor Management, set each vendor's alias and type (subscription / official API), and optionally a per-million-token unit price for cost estimation.
Architecture
- Host half (
lib/index.js): scans durable session logs and aggregates usage (assistant/message.usage+message.source), listens tosession/eventfor live folding; serves data routes via thewebServerservice:GET /api/usage-vendor-stats— stats snapshot (vendors / models / daily / monthly / hourly / totals)POST /api/usage-vendor-stats/vendor— set vendor alias, type, and unit price
- Client half (
lib/client.js):window.__ModuleLoader__factory-format browser bundle, registering the API Usage Stats settings page (settings.sectionslot), a sidebar footer entry (sidebar.footer.action), and a fullscreen panel (shell.overlay).
Development
- Editing
lib/index.js/lib/client.jstakes effect after a page refresh (client bundle loads with the page); host-half changes require a DSH restart. - The plugin has no third-party runtime dependencies: the host half uses only Cordis services, the client half only React (provided by the module table).
License
MIT
中文
DeepSeek Harness 用量统计插件:按厂商(订阅 / 官方 API)× KPI 聚合 API 使用量,带 GitHub 风格日历热力图、趋势折线图与日 / 月 / 小时统计看板。
区别于
dsh-usage-stats(按工作区统计):本插件以**厂商(provider)**为第一维度,自动识别assistant/message事件里的message.source.provider与message.source.model,拆分 token / 缓存命中 / 输出 / 推理等 KPI。
功能
- 厂商维度:自动发现所有使用过的厂商(如
huoshan、hebox、deepseek-official、tokenrhythm、opencode),可手动标记为「订阅 / 官方API」,设置别名(持久化到$DSH_HOME/storages的 KV 单元) - KPI 卡片:总花费 Token(输入 / 缓存命中 / 输出 / 推理分项)、缓存命中率、模型调用次数、回合数、会话数、厂商数量,附多色 Token 构成比例条
- 53 周热力图:GitHub 绿色风格,颜色深浅按当日模型调用次数;点击厂商筛选后仅统计该厂商;悬停查看按厂商明细与 Token 明细
- 趋势折线图:Token / 调用双轴趋势,默认按日;选「今天」时按小时展示(小时级聚合)
- 厂商模型钻取:点击厂商行展开该厂商的逐模型消耗
- 每日明细:近 30 天逐日 Token / 缓存 / 输出 / 推理 / 命中率 / 回合
- 每月汇总:全部历史按月聚合
- 厂商 KPI 表:按总 Token 排序,含命中率、模型数、类型标签;点击行钻取模型
- 时间预设:今天 / 7 天 / 14 天 / 30 天 / 90 天 / 全部
- 费用估算:为每个厂商设置每百万 token 单价,即可看到折算的预估费用列
- CSV 导出:每日 / 每月 / 厂商表格均可导出 CSV
- 健康度/性能卡片:平均首字延迟(TTFT)、生成速度(t/s)、峰值 Context、请求错误率、模型/工具总耗时,聚合自 DSH 的
sessionStats投影 - 时间范围切换、动画、亮暗主题自适应
截图
数据说明
- 数据全部来自 DSH 持久化会话日志:
assistant/message事件携带usage(Token 记账)与message.source.{provider,model}(厂商/模型来源) - Token 统计口径(与 DSH 一致):
inputTokens为未命中输入,cacheReadTokens为缓存命中输入,outputTokens为输出,reasoningTokens为推理,cacheWriteTokens为缓存写入 - 缓存命中率 = 命中 /(命中 + 未命中输入)× 100%
- 插件激活时自动回填全部历史会话;插件卸载 / 重启后数据不丢
安装
本插件是标准的 DSH 社区插件包(声明 dsh.bundle manifest + web client 半)。
从 GitHub 直接安装(推荐)
dsh plugin --profile web add "github:kirigayakazima/dsh-usage-vendor-stats"
安装后刷新页面即可,无需手动改配置、无需重启。
手动注册(本地开发)
- 把本目录放入任意位置,并在
$DSH_HOME/profiles/node_modules/下创建指向本目录的符号链接(Windows 用 junction):New-Item -ItemType Junction -Path "$env:DSH_HOME\profiles\node_modules\dsh-usage-vendor-stats" -Target "<本目录绝对路径>" - 在
$DSH_HOME/profiles/web/cordis.patch.yml添加一行:
用户 patch 层会被热重载:保存后刷新页面即可。- insert: - id: usage-vendor-stats name: dsh-usage-vendor-stats
使用
- 打开 设置(侧边栏底部)找到「API 用量统计」页,或点击侧边栏底部的「📊 用量统计」入口打开全屏面板
- 热力图颜色 = 当日调用次数;点击厂商 chip 或表格行可筛选 / 钻取
- 在「厂商管理」里给每个厂商设置别名与类型(订阅 / 官方API),可选设置每百万 token 单价用于费用估算
架构
- Host 半(
lib/index.js):扫描持久化会话日志聚合用量(assistant/message.usage+message.source),监听session/event实时折叠;通过webServer服务注册数据路由:GET /api/usage-vendor-stats— 统计快照(厂商 / 模型 / 日 / 月 / 小时 / 汇总)POST /api/usage-vendor-stats/vendor— 设置厂商别名、类型与单价
- Client 半(
lib/client.js):window.__ModuleLoader__工厂格式的浏览器 bundle,注册设置面板「API 用量统计」页(settings.section槽位)、侧边栏底部入口(sidebar.footer.action)与全屏面板(shell.overlay)。
开发
- 修改
lib/index.js/lib/client.js后刷新页面即生效(client bundle 随页面加载);host 半改动通过重启 DSH 生效 - 插件包无第三方运行时依赖:host 半只使用 Cordis 服务,client 半只使用 react(模块表提供)
License
MIT
链接
同类插件
bowenliang123/dsh-context★ 1573
DSH 上下文洞察面板:Context 仪表盘 + /context命令 + Context 浏览器,查看 Context的分类组成、内容详情、演进趋势、压缩/注入事件、统计等一站式 Context 全生命周期管理。
Han-1413141/dsh-cost-meter★ 349
会话与当日 API 费用统计、预算图框(已用%)、官方余额、历史看板,支持峰谷计价与官方价格一键同步。
wssfk12138/dsh-damage-pulse★ 224
在 DSH Web 界面追踪 DeepSeek Token 用量、单次与会话费用及账户余额,并显示缓存感知的扣费动画。
zh667/TokenLedger★ 202
侧边栏用量面板:把 Token 归属到实际服务该请求的中转站,站点从已有的 provider 配置中读出,无需额外配置;含今日/本月/累计三窗口、按站点与模型下钻、一年活跃度热力图,以及 New API / Sub2API / DeepSeek 余额。
Ychris12138/dsh-usage-stats★ 169
多供应商用量看板:按供应商/模型统计 Token 与日期下钻,统一展示账户余额,并追踪 OpenCode Go / Z.ai 订阅额度。
PolinniZhong/dsh-personal-center★ 120
DeepSeek Harness 个人中心:跨会话用量统计、按模型成本估算、全局自定义指令、外观全局字号、数据驱动的桌面宠物(位图/矢量皮肤)与会话状态概览,纯本地离线运行。
社区评论
评论公开保存在 GitHub Discussions。加载评论会连接 GitHub 和 Giscus;发表内容需要 GitHub 账号。