Floating GPU monitor for the DSH Web UI: a compact, draggable strip with one row per discrete GPU (exact name, utilization, VRAM, temperature, power draw) from nvidia-smi, stays visible over side panels and side cards, with a top-VRAM-process list when the driver reports it; degrades to an n/a pill on machines without an NVIDIA driver.
Install
# from npm (prebuilt)
dsh plugin --profile web add dsh-gpu-pulse
# from a prebuilt release tarball
dsh plugin --profile web add "https://github.com/zhubaohi/dsh-gpu-pulse/releases/download/v1.2.0/dsh-gpu-pulse-1.2.0.tgz"
# from GitHub (first run asks for allowBuilds approval — follow the hint, retry)
dsh plugin --profile web add github:zhubaohi/dsh-gpu-pulse
Any plugin you install runs third-party code with your own permissions — it can read your files, use your credentials, and reach the network, and tool approvals don’t sandbox it. GitHub-sourced plugins also run build scripts at install time — pnpm blocks those until you allow them, so an install can stop with ERR_PNPM_GIT_DEP_PREPARE_NOT_ALLOWED or ERR_PNPM_IGNORED_BUILDS; dsh prints the exact key to add under allowBuilds in your profile’s pnpm-workspace.yaml, and the install works on the next run. Allowing a build is a trust decision: only install sources you trust, and pin a commit (github:owner/repo#sha).
README
A floating GPU monitor inside the DSH Web UI. Live per-GPU utilization, VRAM, temperature and power, plus the top VRAM-consuming processes when the driver reports them, rendered as a compact, draggable strip (one row per GPU) in the DeepSeek Harness page.
Works on any machine with an NVIDIA driver (Windows or Linux): the data comes from nvidia-smi, so multi-GPU rigs show one instrument block per GPU. nvidia-smi only reports discrete NVIDIA adapters, so integrated GPUs (Intel UHD, AMD iGPU, ...) are never part of the display. No extra service to run and no agent tools to call: the card polls the DSH host's own route.
Note: the plugin is NVIDIA-only (nvidia-smi backend). On machines without an NVIDIA driver it degrades to a small GPU n/a pill and re-probes every 5 minutes, so it lights up on its own once a driver is installed.
Screenshot
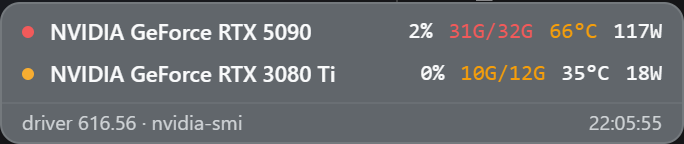
The strip stays on top of side panels and side cards (for example the dsh-better-sidebar Files panel) instead of being covered by them.
Positioning
The strip starts at the bottom-right corner and is draggable: press and drag it anywhere on the page. The position is remembered (persisted per browser profile), so it stays where you left it across new sessions and reboots. Double-click the strip to reset it to the default corner.
Install
# from GitHub
dsh plugin --profile web add github:zhubaohi/dsh-gpu-pulse

# or from a local clone
dsh plugin --profile web add /path/to/dsh-gpu-pulse
The npm name dsh-gpu-pulse is reserved: dsh plugin --profile web add dsh-gpu-pulse will work once the npm package is published.
Then restart dsh web. The strip appears at the bottom-right corner of the GUI; drag it wherever you like and the spot is remembered.
What you see
One row per GPU, intentionally compact (about 85 px for two GPUs):
- status dot: green / amber / red by the worst of the row's thresholds
- name: the exact GPU name as reported by the driver (hover for the GPU index and fan speed)
- GPU: utilization (green below 60%, amber 60-85%, red at 85% and above)
- VRAM: used/total GiB (green below 75%, amber 75-90%, red at 90% and above)
- TEMP: temperature (green below 65 °C, amber 65-80 °C, red at 80 °C and above)
- PWR: power draw (whole watts below 1 kW)
- TOP PROCESSES: the biggest VRAM consumers, when the driver attributes memory per process (most recent Windows drivers report
[N/A]for graphics contexts, in which case this section is omitted) - footer: driver (KMD) version + timestamp of the last sample
The exact GPU name (as reported by the driver) is shown in every row.
Configuration
Everything is optional: defaults work out of the box. Override in the profile's cordis.patch.yml (an id-targeted patch replaces the whole config, so restate every field you want to keep):
- id: dsh-gpu-pulse
  config:
    pollMs: 3000            # client poll interval hint, default 2000, floor 500
    showProcesses: true     # also collect per-process VRAM consumers
    nvidiaSmiPath: 'C:\Windows\System32\nvidia-smi.exe'  # default: "nvidia-smi" via PATH
pollMs is a hint served to the client in every status response, so it applies to all open tabs without a browser-side setting.
How it works
- Host (
index.js): registersGET /dsh-gpu-pulse/statuson the DSH host web server. Each request runs up to fournvidia-smiqueries (--query-gpumetrics,--query-gpu=index,name,--version, and optionally--query-compute-apps) with a 4 s timeout, parses the CSV, and returns JSON. Results are cached for ~1.2 s so several open tabs share one process per poll cycle. - Client (
client/client.js): a hand-written__ModuleLoader__bundle (no build step, the only require is the platformreactseed) that mounts the widget into theshell.overlayslot. It polls the status route, styles itself with the active theme's--dsw-*token variables (static fallbacks keep older hosts readable), and handles its own pointer events for dragging (the position is stored inlocalStorageunder adsh-gpu-pulse:poskey). Because side-panel plugins stack above the overlay slot's default z-index, the client promotes the overlay layer to the top of the app's stack at runtime, so side cards and drawers can never cover the widget.
Requirements
- Node ≥ 18,
dsh web0.1.0-rc.6+ (theshell.overlayslot) - An NVIDIA driver with
nvidia-smionPATH(Windows or Linux) - No runtime dependencies beyond Node builtins
License
MIT, see LICENSE. nvidia-smi is a NVIDIA Corporation tool, invoked read-only.
Links
More in this category
zhu1090093659/dsh-web#packages/dsh-task-board★ 8759
Task board for the dsh web GUI: a sidebar multi-column kanban whose cards run in real DSH agent sessions and can also be scheduled with cron expressions, executed host-side even with the browser closed.
zhu1090093659/dsh-web#packages/dsh-web-all★ 8759
Plugin and skin collection for the DSH Web UI: task board, Git graph, right-side panel, remote mobile UI, pet, live token stats, and a skin center.
MeteorNOX/DeepSeek-Balance-Whale-Widget★ 4819
A fixed-corner whale widget for the DSH web GUI — balance, today's usage and per-turn cost with peak/off-peak pricing, editable balance-alert and daily-budget bubbles, a module-based custom bubble queue with A/B weighted choices and random lines or images, 30+ vendor templates (OpenAI, OpenRouter, Kimi, SiliconFlow, Ark, Zhipu, MiniMax and more) with per-model balance and subscription quota, plus task-end sound, imported audio, custom roles and a resource manager. Local-only, no telemetry.
ccch1mneyyy/dsh-TUI★ 4602
Claude Code-style full-screen terminal UI: pixel-whale header, live status line, and streaming thought expansion.
omdsh-dev/DSH-better-sidebar★ 4181
Full sidebar workbench with file rendering and editing, terminal, Git, and subagents; third-party plugins can register new tabs.
Devin-AXIS/deepseek-design#deepseek-idesign★ 1461
Visual design studio for websites, app prototypes, posters, cards, reports, and magazines, with templates, direct element editing, selection-aware AI draft handoff, and export.
Community comments
Comments are public GitHub Discussions. Loading them connects to GitHub and Giscus; a GitHub account is required to post.