Live subagent run monitor for the Web UI: a sidebar footer trigger plus a fixed top-right card panel showing each subagent of the current session in real time (running/elapsed, terminal outcomes, tree indent), with one-click jump into the child conversation and a return button, refresh-surviving and mobile-hidden by default.
Install
# from npm (prebuilt)
dsh plugin --profile web add @leetoners/dsh-ui-subagent-monitor
# from GitHub (first run asks for allowBuilds approval — follow the hint, retry)
dsh plugin --profile web add github:Mombrane/dsh-subagent-monitor
Any plugin you install runs third-party code with your own permissions — it can read your files, use your credentials, and reach the network, and tool approvals don’t sandbox it. GitHub-sourced plugins also run build scripts at install time — pnpm blocks those until you allow them, so an install can stop with ERR_PNPM_GIT_DEP_PREPARE_NOT_ALLOWED or ERR_PNPM_IGNORED_BUILDS; dsh prints the exact key to add under allowBuilds in your profile’s pnpm-workspace.yaml, and the install works on the next run. Allowing a build is a trust decision: only install sources you trust, and pin a commit (github:owner/repo#sha).
README
中文 | English
✨ What is it
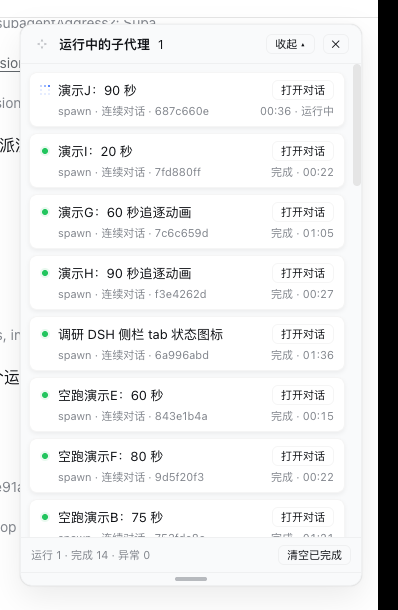
Adds a Subagents entry at the bottom of the DSH Web sidebar and a card-style panel pinned to the top-right corner of the screen, showing the live run status of subagents spawned directly by the current session. Opening a subagent session moves the panel down to that session's direct children.
At the top of the panel sits an overall dashboard: three donut charts on the left show the main session's current context-window occupancy and the cache-hit rates of the main session and the aggregated subagents; a status bar chart on the right shows the current layer's running / done / failed counts (scaled to the largest count). Each card also carries a usage line (that run's input / output, cache hit, and context size).
The panel collapses in two directions, independently of each other:
- Vertically (two-stage): the header's Collapse first hides only the subagent cards below (the overall dashboard above stays; the button becomes "Collapse all"), the second click collapses all the way down to the title bar, and "Expand" restores the full panel in one step.
- Horizontally (folds left into a strip):
◂folds the panel into a 120px strip — the right edge stays anchored, so it folds toward the left; it keeps the context + main-session rings at their full 48px size (the subagent ring is dropped), restacked from a row into a top-to-bottom column, and the subagent cards stay underneath in compact form.▸unfolds back to 340px.
┌─ ⤢ Subagent dashboard ───── [◂] [Collapse ▴] [✕] ┐
│  ◔ ctx ◔ main ◔ subagents     █ run 1 · █ done 1 · █ failed 0 │
│ ┌───────────────────────────────────────────────┐ │
│ │ 🔵 Count TS files in ui dir        [Open chat] │ │
│ │    one-shot · 1a2b3c4d    running · 00:42     │ │
│ │    ↑12.3k ↓4.5k · cache 78% · ctx 45.6k       │ │
│ └───────────────────────────────────────────────┘ │
│ ┌───────────────────────────────────────────────┐ │
│ │ 🟢 Demo subagent: count file types [Open chat] │ │
│ │    spawn · 2b3c4d5e       done · 03:12        │ │
│ └───────────────────────────────────────────────┘ │
│  running 1 · done 1 · failed 0     [Clear done]  │
│ ═══════════════════════════════════════════════ │ ← drag to resize
└───────────────────────────────────────────────────┘
The narrow strip after a horizontal collapse (120px, two rings at full size):
┌ ⤢ 1 [▸][▴][✕] ┐
│      ◔        │  ← ctx
│      ctx      │
│      ◔        │  ← main
│     main      │
│ ┌───────────┐ │
│ │ 🔵 Count …  │ │  ← the whole card is the "Open chat" target
│ │     00:42 │ │
│ └───────────┘ │
│ ┌───────────┐ │
│ │ 🟢 Demo s… │ │
│ │     03:12 │ │
│ └───────────┘ │
│ 1/1/0   [⤢][⌫] │
│ ══════════════ │
└───────────────┘
The
⤢four-arrow grip left of the title moves the panel, the bottom═grip resizes it; both are remembered, double-click resets.Collapse is two-stage (vertical): the first click hides only the subagent cards below (the overall dashboard above stays; the button becomes "Collapse all"), the second collapses to just the title bar, and "Expand" restores the full panel in one step.
◂ / ▸(horizontal): folds left into a 120px strip / unfolds right back to 340px. The strip keeps the context + main-session rings (full size) restacked vertically plus the subagent cards; the narrow/wide choice is remembered across sessions. The two directions compose — a narrowed panel still supports both vertical collapse stages.
🎯 Features
| Feature | Description |
|---|---|
| 🟢 Live status | running (🔵 blue pixel-chase animation, same as the DSH sidebar state dot + stopwatch), done (green dot + halo), failed, interrupted, token limit, rejected |
| 🃏 Card list | one rounded card per subagent; Open chat on the right, status and elapsed time on the second line |
| 🔽 Layered view | shows only subagents spawned directly by the current session; open one to inspect its next layer |
| 🔙 One-click back | inside a subagent session, the panel shows a ← Parent session button that jumps to the direct parent |
| 🖐 Movable | drag the four-arrow grip left of the title to move the panel; position is remembered (shared across sessions), double-click resets |
| 📏 Resizable | drag the bottom grip to resize the panel height; height is remembered per session, double-click resets |
| 🪗 Two-stage collapse (vertical) | the header's Collapse first hides only the subagent cards (the overall dashboard above stays); Collapse all then reduces it to just the title bar; Expand restores the full panel in one step |
| ↔️ Horizontal collapse (leftward) | ◂ folds the panel into a 120px strip, right edge anchored so it folds left; keeps the context + main-session rings (full size) restacked top-to-bottom, drops the subagent ring, and the subagent cards stay underneath (compact, the whole card opens the chat); narrow/wide is remembered across sessions. Orthogonal to the vertical two-stage collapse — the two compose |
| 🔄 Refresh-proof | persistent composition row: the panel auto-recovers after page refresh / service restart |
| 💤 Quiet when idle | the snapshot poll only runs while the panel is open and the tab is visible; closing the panel or backgrounding the tab stops the timer, and reopening / refocusing fetches once up front before the 1s cadence resumes |
| 📊 Overall dashboard | summary strip above the cards: three donut charts (main-session current context-window occupancy, main-session / subagent cache-hit rates) + a status bar chart (running / done / failed counts, scaled to the largest count) |
| ⚡ Usage line | each card shows that run's input / output tokens, cache-hit rate, accumulated context, and context-window utilization (when the provider reports it) |
| 🎯 Current occupancy | the main session's "context" ring shows the current window occupancy (projectedTokens: newest prompt sample + heuristic surface movement) — it rises as content lands and drops immediately after compaction, rather than the session-cumulative figure that only grows |
| 🌐 Chinese / English | panel copy follows the host UI language (Settings → General → Language); it falls back to Chinese when the host names no language, or one it ships no copy for |
| 📱 Mobile-friendly | hidden by default at ≤768px viewport; the sidebar entry still opens it manually |
📦 Installation
Option A · npm (recommended, one line)
dsh plugin --profile <your-profile> add @leetoners/dsh-ui-subagent-monitor
✅ Published as
v0.5.0(built and signed by GitHub Actions; SLSA provenance verifiable).
Option B · Install from GitHub
dsh plugin --profile <your-profile> add github:Mombrane/dsh-subagent-monitor
# On first install, if prompted to allow build scripts, confirm in the profile's pnpm-workspace.yaml
Restart dsh web to take effect. This repository is both a DSH client plugin (dsh.client) and a composition bundle (dsh.bundle + cordis.patch.yml), shipped with a prebuilt lib/.
Option C · Inline into the DSH source tree (for secondary development)
# 1. Copy this repo's src/ to <dsh>/packages/client/ui-subagent-monitor/
# 2. Add the dependency to <dsh>/packages/bundle/web-app/package.json
"@leetoners/dsh-ui-subagent-monitor": "workspace:*"
# 3. <dsh>/packages/bundle/web-app/cordis.patch.yml (after the ui-subagent row)
- id: ui-subagent-monitor
  name: '@leetoners/dsh-ui-subagent-monitor'
# 4. Build + restart
pnpm install && pnpm --filter @leetoners/dsh-ui-subagent-monitor bundle
# restart dsh web
Also add this package path to
referencesin /tsconfig.client.json, and point this package'stsdown.config.tsat the monorepo preset (import { clientBundle } from '../tsdown.client.ts').
🧩 Compatibility
DSH STORE's automated recheck only accepts per-release records with full SemVer keys in package.json; a range alone is not installable evidence. This plugin declares:
| Item | Declaration |
|---|---|
| DSH range | >=0.1.0-rc.0 |
| Node.js | ^22.19.0 or >=24.0.0 (same as DSH itself) |
0.1.5-alpha.2 · 0.1.5-rc.1 · 0.1.5-rc.2 |
compatible |
The compatible marks above are not inferred — they were measured on disposable profiles on 2026-09-14, one per release: separate DSH_HOME → dsh plugin --profile web add (bundle layer composed) → dsh web boots with the panel rendering in the browser and GET /api/subagent-monitor/snapshot returning 200 → dsh plugin --profile web remove drops that route back to 404 and empties the bundle layer. Any DSH release not listed is unknown.
🏷️ Status legend
| Status | Meaning |
|---|---|
| 🔵 Running | in progress, blue pixel-chase animation (same as the DSH sidebar tab ongoing state) + live stopwatch |
| 🟢 Done | the panel witnessed a successful finish; shows elapsed time (green dot + halo) |
| ⚪ Ended | backfilled history row: created before a service restart, outcome not observed (success/failure unknown) |
| 🔴 Failed | ended in error (red dot + halo) |
| 🟠 Interrupted / token limit / rejected | aborted / hit the token cap / request rejected (amber dot + halo) |
❓ FAQ
Does the panel disappear on page refresh? No. It is a persistent composition row; the panel auto-recovers on every page load.
What is the difference between “Done” and “Ended”? 🟢 is an outcome the panel observed live; ⚪ is history from before a service restart, outcome not observed.
How much history does the panel keep? At most 200 rows per direct parent session; the oldest ended rows are evicted beyond that.
Are the panel position and height remembered? Yes, with two different policies: the position is shared across sessions (one spot for all of them), while the height is remembered per session (localStorage key carries the session id, so switching sessions never leaks the size); they survive page reload / browser restart. Double-click a grip to reset.
Where do the usage / cache numbers come from? They are folded from each subagent's own session log — provider-reported TokenUsage on assistant/message events. Live children are read from memory; cold ones from the persisted log (cached). Data appears only when the adapter reports usage; otherwise the panel shows “—”.
Is it safe? The polling route /api/subagent-monitor/snapshot binds to the loopback address with no auth; recommended for local / intranet use only.
🌐 Ecosystem
| Channel | Status |
|---|---|
| GitHub topics | dsh-plugin, deepseek-harness (auto-synced by Oh-My-DSH every 4 hours) |
| Oh-My-DSH catalog | PR #8 pending maintainer merge |
| awesome-dsh-plugin | ✅ Listed (commit c7ad36e9, PR #675 merged) |
📋 Changelog
See CHANGELOG.md for the full history. Current version 0.5.0 (aligned with package.json).
📖 Architecture
Design decisions (why persistent, why a custom polling route, event attribution model) and data-flow details: ARCHITECTURE.md.
📄 License
MIT © Mombrane
Links
More in this category
zhu1090093659/dsh-web#packages/dsh-task-board★ 8121
Task board for the dsh web GUI: a sidebar multi-column kanban whose cards run in real DSH agent sessions and can also be scheduled with cron expressions, executed host-side even with the browser closed.
zhu1090093659/dsh-web#packages/dsh-web-all★ 8121
Plugin and skin collection for the DSH Web UI: task board, Git graph, right-side panel, remote mobile UI, pet, live token stats, and a skin center.
omdsh-dev/DSH-better-sidebar★ 3868
Full sidebar workbench with file rendering and editing, terminal, Git, and subagents; third-party plugins can register new tabs.
ccch1mneyyy/dsh-TUI★ 3734
Claude Code-style full-screen terminal UI: pixel-whale header, live status line, and streaming thought expansion.
MeteorNOX/DeepSeek-Balance-Whale-Widget★ 3369
A fixed-corner whale widget for the DSH web GUI — balance, today's usage and per-turn cost with peak/off-peak pricing, editable balance-alert and daily-budget bubbles, a module-based custom bubble queue with A/B weighted choices and random lines or images, 30+ vendor templates (OpenAI, OpenRouter, Kimi, SiliconFlow, Ark, Zhipu, MiniMax and more) with per-model balance and subscription quota, plus task-end sound, imported audio, custom roles and a resource manager. Local-only, no telemetry.
Devin-AXIS/deepseek-design#deepseek-idesign★ 1665
Visual design studio for websites, app prototypes, posters, cards, reports, and magazines, with templates, direct element editing, selection-aware AI draft handoff, and export.
Community comments
Comments are public GitHub Discussions. Loading them connects to GitHub and Giscus; a GitHub account is required to post.