Adds a Graph tab that renders one session's execution as an interactive DAG of turns, LLM steps, tools, skills, subagents, code changes and tests, with live status, retry aggregation, critical path and trajectory linkage.
Install
# from npm (prebuilt)
dsh plugin --profile web add dsh-task-graph
# from GitHub (first run asks for allowBuilds approval — follow the hint, retry)
dsh plugin --profile web add github:KevinZhangNothing/dsh-task-graph
Any plugin you install runs third-party code with your own permissions — it can read your files, use your credentials, and reach the network, and tool approvals don’t sandbox it. GitHub-sourced plugins also run build scripts at install time — pnpm blocks those until you allow them, so an install can stop with ERR_PNPM_GIT_DEP_PREPARE_NOT_ALLOWED or ERR_PNPM_IGNORED_BUILDS; dsh prints the exact key to add under allowBuilds in your profile’s pnpm-workspace.yaml, and the install works on the next run. Allowing a build is a trust decision: only install sources you trust, and pin a commit (github:owner/repo#sha).
README
中文 | English
An interactive execution-flow graph for a single task in DeepSeek Harness (DSH): see the whole run at a glance —
task start → Agent / Skill / Tool → subtasks → code changes → tests → success / failure / retries— with live execution status and historical replay.
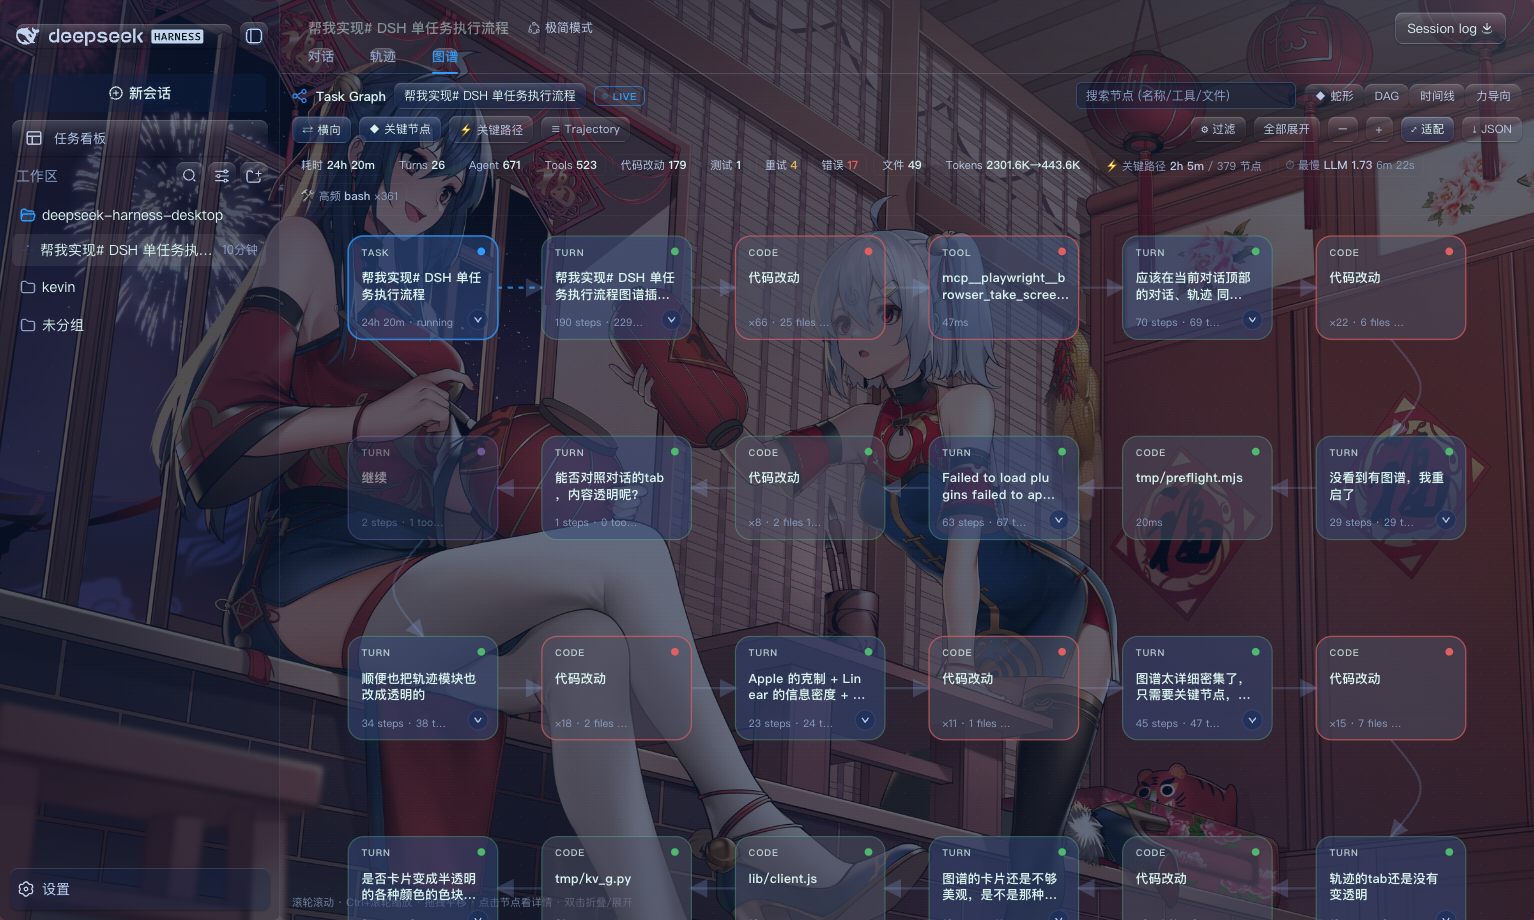
- Task First — the first-class concept is the Task (one session), not a Session/Message/Event firehose.
- Graph First — open a task and see the execution graph, not a wall of logs.
- Detail on Demand — the canvas shows key nodes only; what exactly happened (every LLM step, every tool call, inputs/outputs, errors, retries) lives in the detail panel.
- Trajectory as the data layer — graphs are built from
session.jsonl(zstd); nodes keep their Event IDs and link both ways to the raw trajectory.
Design Language
Restrained information visualization blending four sensibilities:
| Influence | In the product |
|---|---|
| Apple restraint | hairline borders, desaturated palette, soft glows instead of heavy shadows, status = tint + dot |
| Linear density | compact toolbars, tabular numerals, dense detail logs, more per screen |
| Vercel precision | global tabular-nums, uppercase micro-labels, pixel-aligned spacing, elevation only on floating surfaces |
| Live agent feel | pulsing RUNNING nodes with per-second timers, animated dash-flow on active edges, breathing LIVE badge |
The UI is glassmorphic: graph / detail / trajectory sit transparent over your skin wallpaper, exactly like the native Conversation/Trajectory tabs. Every card is tinted by node type (task blue · turn indigo · agent cyan · tool slate · skill violet · subagent amber · plan green · code orange · test sky).
Features
Key-node view (default canvas)
The canvas shows only semantically important nodes, so 500-step sessions stay readable:
- Turn cards carry a summary line (
N steps · N tools · N tok · ↻retries · ✗failures) - Code change batching: many edits in one turn collapse into one
×N · M filescard - Kept events: Plan / Skill / SubAgent / Tests / failed-or-retried tools / LLM retries
- Plain steps and read-only tools stay off the canvas — they are all in the detail panel
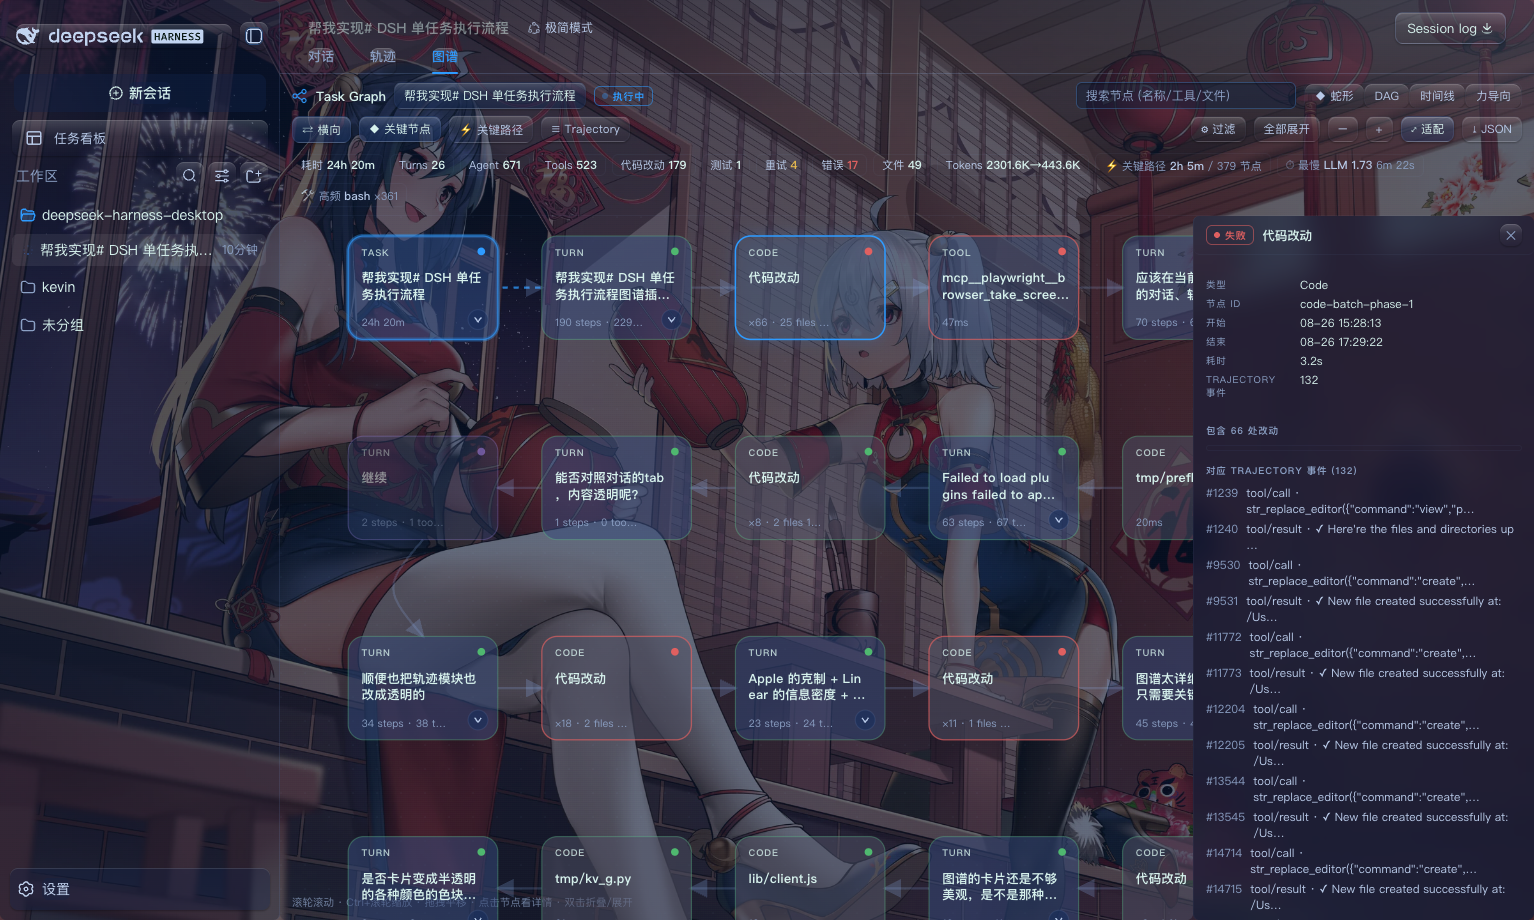
Click any key node and the right-hand panel shows what actually happened:
- Click a Turn → “Execution detail · N steps”: every LLM step (model / duration / tokens / retries) plus all its tool calls
- Click Code changes → “N edits included”: file-level list; click a row to drill into that edit's input/output
- Any tool row is clickable and drills deeper
Layouts & interaction
- Snake (default) — up to 6 key nodes per row, left→right, wrap down, right→left (boustrophedon); ordered by the task→turn→key-event execution narrative, so you read the whole run like a document
- DAG — layered directed graph (horizontal), for hierarchy/dependency reading
- Timeline — events placed at their real timestamps; parallels and costs at a glance
- Force — free exploration of complex relations
- Wheel scrolls vertically through long graphs;
Ctrl/⌘ + wheelzooms at the cursor (bounded 0.3×–2.2× so it never shrinks unreadably); drag to pan, ⤢ fit-to-width, ⇕ collapse-to-turns overview / expand all, type filters, search, focus node, neighborhood highlight
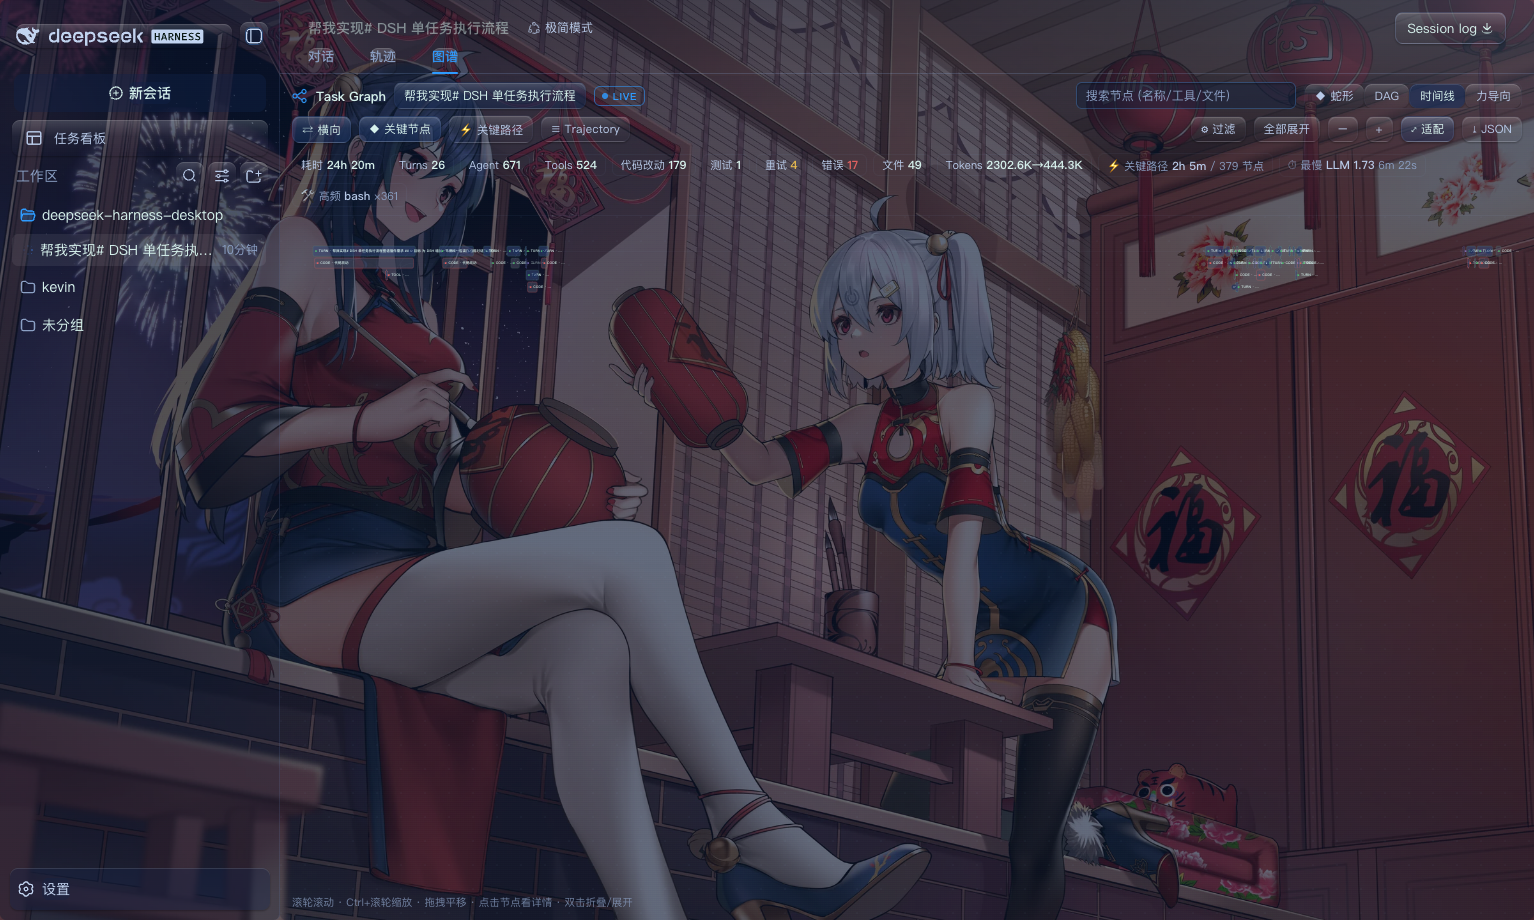
Live execution state
Running sessions refresh incrementally over SSE:
RUNNINGnodes pulse and tick per second (18.2s · running, live)- Edges touching running nodes animate a dash flow — data in motion
- LIVE badge up top; status machine
PENDING / RUNNING / SUCCESS / FAILED / SKIPPED / CANCELLED / RETRYING
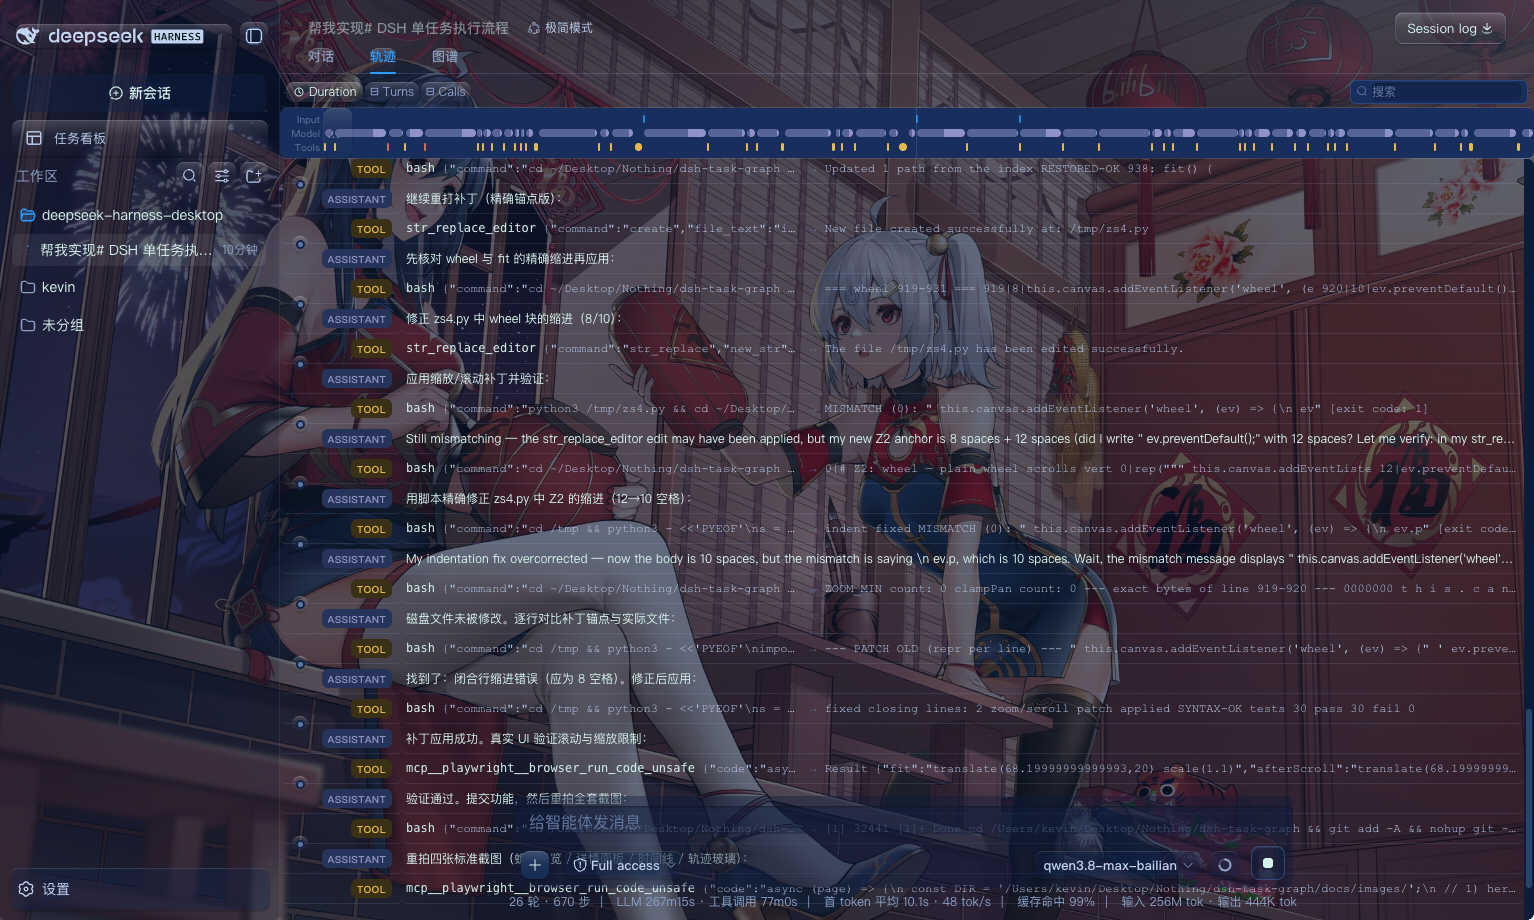
Graph ↔ Trajectory, both ways
- Click a node → the trajectory drawer highlights and scrolls to its events
- Click an event row → the matching graph node is selected and focused
- Nodes keep
event_ids/session_id/task_id/ timestamps — always answerable: “which Event is this node?” - The Trajectory tab itself is glass-transparent, matching Conversation and Graph
Analysis & localization
- Critical path — the duration-dominating chain, auto-computed and highlighted (projects to turn level in key view)
- Error localization — failed nodes go red, bundling message / I-O / retry history / recovery
- Retry aggregation — retries of an identical call never duplicate nodes; they aggregate as attempts + a retry arc
- Task summary — duration; turns / agents / tools / skills / subagents / code changes / tests / retries / errors; tokens; slowest steps; most-used tools
- Parallel execution — concurrent tools within one step render as fork → join
- Subtask drill-down — SubAgent nodes link their child session; open the child graph in one click
Quick Start
Standalone demo (no DSH needed)
npm run demo            # scripted data (includes a live RUNNING task)
npm run demo -- --real  # read your real $DSH_HOME sessions
npm run demo -- --port 8123
Open the printed URL; the graph floats over the page and auto-loads a task.
Install as a DSH plugin (one line)
dsh plugin --profile web add github:KevinZhangNothing/dsh-task-graph
dsh plugin runs pnpm and automatically registers packages declaring dsh.bundle into dsh.profile.bundles (verified). Restart the engine (or reload the Web UI) and a third Graph tab appears beside the native Conversation / Trajectory tabs.
Once published to npm:
dsh plugin --profile web add dsh-task-graph. Also searchable in the plugin marketplace (dshmarket).
The Graph tab renders only inside the content area — tab bar, sidebar and every other entry point stay visible. Click back to Conversation / Trajectory or press Esc to return.
Local development install
dsh plugin --profile web add link:/path/to/dsh-task-graph
# or manually: pnpm add "dsh-task-graph@link:/path/to/dsh-task-graph" inside the profile dir
The server half needs Node ≥ 22.15 (built-in
zlib.zstdDecompressSyncdecodes.zstdsessions — zero native dependencies).
Architecture
DSH session.jsonl (zstd, multi-frame)
        │  lib/sessions.js  frame-by-frame decode + cache + incremental tail
        ▼
lib/graph.js  buildGraph(events)      ← pure functions, Node/browser shared
        │   nodes[] + edges[] + summary
        ▼
lib/analytics.js  criticalPath / performanceProfile
        ▼
lib/routes.js  createApi(store)       ← /task-graph/api/* (tasks/graph/events)
        │                               + startLiveStream (SSE live tail)
        ├──────────────┬───────────────────────────┐
        ▼              ▼                            ▼
 lib/index.js     demo/server.mjs            lib/client.js
 (mounts HTTP      (standalone demo          (browser UI: SVG rendering,
  routes on the     server)                   layouts, detail panel,
  DSH webServer)                              trajectory linkage)
lib/graph.js/lib/analytics.jsare pure modules shared by the server, the demo and the unit tests — one build pipeline everywhere.lib/client.jsis dependency-free DOM + SVG; loads via DSH'swindow.__ModuleLoader__inside the web UI, or as a plain<script>in the demo page.
HTTP API
Read-only GET, prefix /task-graph:
| Route | Description |
|---|---|
/task-graph/api/status |
health, version, DSH_HOME |
/task-graph/api/tasks?roots=true&q=&limit= |
task (session) list + summary stats |
/task-graph/api/task?id=<workspace>/<dir> |
full graph (nodes/edges/summary/critical_path) |
/task-graph/api/events?id=…&from= |
compact trajectory events (linkage drawer) |
/task-graph/api/event?id=…&seq= |
one full event payload |
/task-graph/api/live?id=… |
SSE live tail of new events |
Data Model
Graphs are uniform (see docs/data-model.md):
{
  "task_id": "…",
  "nodes": [{ "id": "…", "type": "agent", "status": "SUCCESS", "event_ids": [12, 13], "parent_id": "phase-1", "…": "…" }],
  "edges": [{ "source": "…", "target": "…", "type": "calls" }]
}
- Node types:
task / phase / agent / tool / skill / subagent / code / test / plan - Node statuses:
PENDING / RUNNING / SUCCESS / FAILED / SKIPPED / CANCELLED / RETRYING - Edge types:
contains / depends_on / calls / invokes / delegates / consumes / modifies / validates / produces / retries
Development
npm test        # node:test suite (30 cases)
npm run demo    # local preview
Layout:
lib/        index.js server entry · sessions.js decoding · graph.js builder ·
            analytics.js analysis · routes.js HTTP API · client.js browser UI
demo/       server.mjs · index.html · sample-events.js (scripted data)
test/       node:test suites + fixtures
docs/       data-model.md · trajectory-events.md · spec.md · images/
Roadmap
- MVP: single-task graph, Task→Agent→Tool→Result, DAG, statuses, detail panel, Graph↔Trajectory, zoom/collapse, retries, live updates
- Phase 2: Skill/SubAgent, parallelism, loops, critical path, timeline, tokens/summary, search/filter
- Experience polish: key-node view, type-tinted cards, snake layout, bounded zoom + vertical scrolling, glass theme, live timers/flow edges
- Phase 3: business-knowledge nodes, code semantic graph (Producer/Transformer/Consumer, call chains), candidate-code → Patch → Test loop
License
MIT
Links
More in this category
zhu1090093659/dsh-web#packages/dsh-task-board★ 8639
Task board for the dsh web GUI: a sidebar multi-column kanban whose cards run in real DSH agent sessions and can also be scheduled with cron expressions, executed host-side even with the browser closed.
zhu1090093659/dsh-web#packages/dsh-web-all★ 8639
Plugin and skin collection for the DSH Web UI: task board, Git graph, right-side panel, remote mobile UI, pet, live token stats, and a skin center.
MeteorNOX/DeepSeek-Balance-Whale-Widget★ 4515
A fixed-corner whale widget for the DSH web GUI — balance, today's usage and per-turn cost with peak/off-peak pricing, editable balance-alert and daily-budget bubbles, a module-based custom bubble queue with A/B weighted choices and random lines or images, 30+ vendor templates (OpenAI, OpenRouter, Kimi, SiliconFlow, Ark, Zhipu, MiniMax and more) with per-model balance and subscription quota, plus task-end sound, imported audio, custom roles and a resource manager. Local-only, no telemetry.
ccch1mneyyy/dsh-TUI★ 4296
Claude Code-style full-screen terminal UI: pixel-whale header, live status line, and streaming thought expansion.
omdsh-dev/DSH-better-sidebar★ 4116
Full sidebar workbench with file rendering and editing, terminal, Git, and subagents; third-party plugins can register new tabs.
Devin-AXIS/deepseek-design#deepseek-idesign★ 1449
Visual design studio for websites, app prototypes, posters, cards, reports, and magazines, with templates, direct element editing, selection-aware AI draft handoff, and export.
Community comments
Comments are public GitHub Discussions. Loading them connects to GitHub and Giscus; a GitHub account is required to post.